Thursday, April 05, 2018

Not A Unique Equity Market: Higher Prices Ahead?

About a year and a half ago I wrote a post on the current equity market that broke out of a thirteen year trading range in 2013 and compared it to the bull markets of the 1950s and 1980s. A number of policy issues being pursued today have similarities to ones in those two decades and below is a brief summary of what I wrote then:
"...potential commonality to the current market compared to those prior decades related to policy decisions coming out of Washington, D.C. In the 1950's the Gross National Product in the U.S. more than double from 1945 to 1960. Government spending in the 1950's was targeted at construction of the interstate highway system, building of schools and an increase in military spending. In the 1980's President Reagan's policies focused on reducing the tax burden on Americans, lowering government regulation and shrinking government itself. President Elect Donald Trump also projects to implement similar policies, i.e., reduce regulation, shrink the government, increase spending on infrastructure and lower taxes. For investors the question to answer is what market segments worked then and might these same sectors outperform early in a Trump administration."
An update to a chart in that earlier post is shown below and in spite of the size of the 'point' swings in the market today, the path of this current bull market is not unique. If history is any guide, and given similar policies out of Washington as in the 1950's and 1980's, the S&P 500 Index certainly appears to have more room to the upside. In fact, the market maybe nearing a point of a sustained upside move.


One thing investors experienced in the first quarter was a return of volatility to the equity markets, and the bond market for that matter. Wednesday's market action was a perfect case in point as the Dow Jones Industrial Average traded down over 500 points near the open yet closed up 230 points, a trading range of more than 700 points. The catalyst for the market swing seems to be connected to the discussion around tariffs and the potential negative implications resulting from the tariff negotiations. I stress 'negative' as most of the tariffs have not been instituted, yet it is the unknown that can cause difficulty for the equity markets.

I can list a number of additional potential negative issues with any single one being a headwind for the equity market: rising interest rates and consequent flattening yield curve, growth in deficit spending out of Washington and more. All but the interest rate factor are mainly political events and I would say business fundamentals and economic fundamentals remain more important variables for the market right now. Given some of the negative factors cited, just maybe the market will climb the proverbial wall of worry.

I am not recommending burying one's head in the sand regarding some of these potential headwinds. What is important though is not to place out sized weight on the 'noise' at the expense of underlying fundamentals. Importantly, policies being pursued today have similarities to policies implemented in earlier decades and those policies were bullish for stocks then.


Monday, April 02, 2018

A More Challenging But Normal Equity Market

Before I left for a week of vacation at the end of March, the equity markets had begun to exhibit a higher level of volatility. This seems to occur more often than not around this time period each year. This heightened volatility was to the downside and I wrote a post before leaving town noting this was more typical market action. What has been so abnormal about the equity market over the past five years is the fact nearly every calendar quarter since 2013 has generated a positive return. As the below chart shows, prior to 2013, this was certainly not the case.


Saturday, March 24, 2018

Recent Equity Market Weakness A Symptom Of A More Normal Market

This past week was certainly a difficult one for the market and by default, a difficult one for investors. Most of the weakness occurred on the last two days of the week, which resulted in the week's return for the S&P 500 Index ending at a negative 5.98%.


Thursday, March 15, 2018

Improved Earnings Growth Expectations Broadly Reduce PEG Ratios

Before passage of The Tax Cuts and Jobs Act in December, earnings growth for the S&P 500 was expected to be low double digits in calendar year 2018. Since passage of tax reform, a significant improvement in earnings growth expectations has occurred. The below table shows I/B/E/S earnings growth expectations in October by sector and for the S&P 500 Index compared to expectations as of the end of last week.


Tuesday, March 13, 2018

Near Record Small Business Optimism

Today the National Federation of Independent Business (NFIB) reported small businesses are showing unprecedented optimism. The NFIB Small Business Optimism Index was reported at 107.6, the second highest reading in the 45-year history of the Index. The highest reading recorded was 108.0 in 1983.


Monday, March 12, 2018

Bond Yield To Stock Yield Spread Sufficiently Wide To Challenge Stock Returns

A little over a year ago I noted the yield on the 10-year Treasury surpassed the dividend yield of the S&P 500 Index. With rising bond yields, there becomes a point when the bond yield is sufficiently high relative to the yield on stocks that bonds can challenge stock returns. In that earlier article I referenced a research article written by CFRA Research's Sam Stovall and titled, Rising Prices, Shrinking Yields. In the research article it was noted prospective stock returns became most challenged when the yield on the 10-year U.S. Treasury exceeded the dividend yield of the S&P 500 Index by at least one full percentage point, i.e. 100 basis points. The forward return at varying spreads is detailed below.


Sunday, March 11, 2018

Individual Investors Favoring Technology Stocks

Periodically I review the most active stocks individual members of Better Investing indicate they are purchasing. A notable feature on the current list is the fact technology related stocks are dominating member purchases.


Additionally, after the market's close on Friday, I posted a tweet noting Fidelity customers' top purchases. Again, technology stocks are gaining the interest of Fidelity's individual investors.


With both the technology sector SPDR (XLK) and the Nasdaq Index both achieving record highs on Friday, one might believe the technology sector is getting over heated. The interest in technology has led to acronyms for various groups of stocks, with the most familiar being the FAANGs, representing Facebook (FB), Amazon (AMZN), Apple (AAPL), Netflix (NFLX) and Google (GOOGL), now known as Alphabet. As the below chart shows, the technology sector in the S&P 500 Index accounts for 25.2% of the index weighting and is approaching the technology bubble peak of 32.9%. One major difference today though is the fact the valuation of the technology sector holdings is not even close to the bubble peak valuation. At the height of the technology bubble in 2000, the technology sector P/E equaled 82 times trailing earnings. Today, the trailing technology sector P/E is 23 times earnings.


In spite of the fact a few technology or technology related stocks trade at higher P/E multiples, the valuations are far from bubble levels seen in 2000.


Friday, March 09, 2018

Sentiment And Economic Data Laying The Foundation For Higher Stock Prices

The headline number of an increase of 313,000 in February's non-farm payrolls this morning was big. This is the largest monthly increase since July 2016. The high end of consensus estimates was for a 230,000 increase in payrolls. December and January reports were also revised higher.


Thursday, March 08, 2018

Trade Deficit And Tariffs: It Is Complicated

President Donald Trump's announcement that he is instituting tariffs on imported steel and aluminum came as a surprise to some although reducing the trade deficit was one of his campaign promises. Dealing with the trade deficit issue is a complicated one since no one factor impacts trade. What is complicating a necessary discussion at the moment is the vitriol in which President Trump's tariff proposal is being discussed. For example, the media repeated commentary that the market would collapse once President Trump signed the tariff executive order; yet the S&P 500 Index closed almost .50% higher today.


Sunday, March 04, 2018

Rising Interest Rates A Headwind For Dividend Paying Stocks

Since July 2016 the yield on the 10-year US Treasury Note has increased from 1.32% to nearly 3% today. This doubling of longer term interest rates is creating a headwind for dividend paying stocks resulting in their underperformance versus their non-dividend paying counterparts as well as the broader S&P 500 Index.

The maroon line in the below chart represents the total return for the S&P 500 Index divided by the total return for the iShares Select Dividend ETF (DVY), When the maroon line is moving higher, the S&P 500 Index is outperforming the iShares Dividend ETF. Clearly the broader S&P 500 Index has been outperforming the dividend payers since July 2016. The blue line on the chart represents the yield on the 10-year U.S. Treasury Note and it is not a coincidence that the dividend payers are underperforming just as the 10-year Treasury yield began to rise in July of 2016.


Saturday, March 03, 2018

Sentiment And Economic Data Mostly Positive

A colleague and I just returned from a week long trip in south Florida visiting some of our clients on both the east and west coast of the state. One notable factor was the very high level of activity everywhere we visited. Restaurants were all packed, road traffic was unbelievably jam packed and the number of semis on the road seemed higher than usual, and usually those trucks do not drive around empty. We visited a new golf course development and the activity was anything but recessionary like. The bottom line is sentiment is highly positive and supports recent economic data releases focused on sentiment and economic indicators.


Saturday, February 17, 2018

Continuing To Favor U.S. Large Cap Stocks Over U.S. Small Cap Stocks

With the passage of tax reform, one market segment one might believe experiences an outsized benefit to earnings is U.S small cap stocks. This certainly seems plausible due to the fact smaller companies tend to have less direct exposure to foreign revenue; therefore, likely generating most of their profits in the U.S.

Our firm exited completely the U.S. small cap space in late 2013 based on a number of factors, with one being the relative valuation of small cap stocks versus large cap stocks. Reviewing the relative valuation of small caps versus large caps based on price earnings ratios has certainly turned to favor small over large as can be seen in the chart below.


Wednesday, February 14, 2018

Small Businesses Remain Highly Optimistic

Tuesday's report by NFIB on small business optimism for the month of January places the reading in the top five highest coming in at 106.9. According to NFIB the response to "Now Is A Good Time To Expand" was 32% and is the highest level for this category in the Indexes 45-year history. Today's strong NFIB report comes on the heals of a record level of optimism in 2017. NFIB President and CEO, Juanita Duggan noted,


Tuesday, February 13, 2018

Enhancing Investment Results By Utilizing An Investment Mentor

In a recent article, Strong Hands - Bridging the Behavior Gap, by Pim van Vliet, PhD, a Managing Director at Robeco Institutional Asset Management, it was noted that,
"the average mutual fund investor lags a buy-and-hold strategy by -1.9%. This finding is persistent across different styles, varying from -1.3% for value investors to -3.2% for growth investors. Also 'passive' investors in market funds underperform a buy-and-hold strategy by a whopping -2.7%."


Monday, February 12, 2018

Dow Dogs Struggle Early In 2018

The Dogs of the Dow of 2018 include two newcomers, General Electric (GE) and Procter & Gamble (PG). These two stocks made the list of top 10 dividend yielding stocks in the Dow Jones Industrial Average Index for 2018 and replaced Boeing (BA) and Caterpillar (CAT). Unfortunately the new additions are weighing down the performance of the Dow Dogs so far this year as they are the worst performing stocks out of the ten Dow Dogs year to date through Friday's market close.


Sunday, February 11, 2018

Last Week Was The Beginning Of An Equity Market Returning To Normality

Some are saying last week's market movement is one for the record books. I have seen descriptions noting the market decline was unprecedented or the market is in turmoil. S&P Dow Jones Indices Indexology Blog titled a post, I'm Exhausted, but outlines data that places the market decline in perspective. One data point in S&P's post,
"Keeping perspective, as repeatedly noted, while 1000 point declines make for frightening headlines, the percentage changes represented by those moves are not uncommon. To wit, there have been nearly 300 daily 4% or greater moves since the DJIA’s inception. Put another way, 3 of the top 10 worst point drops on record occurred during this recent spell; none of them, however, come anywhere near the worst percentage."


Thursday, February 08, 2018

A Reversal In Bullish Investment Sentiment

I have often written that sentiment measures are most valuable at their extremes. Also, they tend to be most representative of potential market turning points when the extreme is at the bearish end of the spectrum. However, in hindsight, it appears recent excessive bullishness for individual investors and institutional investors indicated a cautionary equity market outlook would have been profitable.

The first chart below represents individual investors' bullish sentiment responses as reported weekly by The American Association of Individual Investors. On January 4 of this year bullish sentiment spiked to near 60% and represents a high level for this reading. About a month later, the 8-period moving average reached near 51%, also a high level for the 8-period average, although the average has exceed 60% in the past. 


Tuesday, February 06, 2018

Volatility Returns

Unwelcome, Unpleasant, Inevitable. The recent spike in volatility has certainly caught the attention of investors over the past several days and as corrections go, the market drop has been quick and sharp. 


Tuesday, January 30, 2018

Pullbacks Are A Normal Part Of A Bull Market

During the Fed's move to increase short term interest rates, some have expressed concerns due to the yield curve's increased flattening, i.e., short rates moving higher versus long term interest rates. This increased flattening move can be seen in the below chart and the concern centers around the fact that every recession since 1960 has been preceded by an inverted yield curve, i.e., short term rates higher than long term rates. The move by the Fed to push short term rates higher is part of a normal process to get interest rates back to a normalized level.


Saturday, January 20, 2018

Will The Stock Market Ever Decline Again?

For many investors it may seem difficult to believe since it has been so long ago, but the equity markets do go through negative returning periods. The average intra-year decline for the S&P 500 Index since 1980 is 14% and the last double digit decline was in February 2016, nearly two years ago. So what in the world is going on that has stocks in what seems an uninterrupted climb?

The below 'monthly' chart shows the S&P 500 Total Return Index since the beginning of 2016. Over the course of the two years, 2016 and 2017, the S&P 500 Index has experienced only three negative returning months (red bars) with no down months in 2017. The last bar on the chart represents the January 2018 return and the start of this year has been decidedly bullish.


Saturday, January 13, 2018

A Balancing Oil Market, But Will It Last?

In May 2011 crude oil (WTI) hit $113 per barrel and remained elevated at or near that level until the summer of 2014. Given the high price of crude and the expansion of fracking at that time, crude supply continued to grow until peaking in mid 2017. I wrote about the high crude supply level in mid 2017 and its impact on keeping oil prices down, Higher Oil Prices Contend With Too Much Supply And Higher Energy Efficiency. Today, we are seeing crude oil inventory decline at a fairly rapid rate as can be seen with the green line in the below chart.


Thursday, January 11, 2018

Investor Sentiment More Actionable At Market Bottoms

Today's weekly AAII Sentiment Survey reports a drop in bullish investor sentiment of 11.1 percentage points to 48.7%. The bullish sentiment reading has been on a steady move higher since November 16 when the bullishness reading was 29.4%. The weekly readings tend to be more volatile and one can look at the 8-week moving average in order to eliminate some of this volatility. As a result, although the sentiment reading fell this week, the longer period average of bullish sentiment increased to 45.6%, largely due to dropping the 29.4% bullishness reading from November 16.


Wednesday, January 10, 2018

Winter 2017 Investor Letter: An Uninterrupted Climb

Our Winter 2017 Investor Letter provides commentary on 2017 and our thoughts and observations on the coming year. Many strategists and investors have either commented on or know from first hand experience, in 2017 the equity market saw very little downside market volatility. Our expectation for 2018 is the market will see a more normal level of volatility. As we comment on in our Investor Letter, that normal level of volatility would be a 14.1% decline from peak to trough. A decline of that percentage amount would equal 3,500 Dow points, and that would represent a normal pullback.


For additional insight into our views for the market and economy in the coming year, see our Investor Letter accessible at the below link.


Monday, January 08, 2018

High Beta Stock Outperformance Suggests A Strengthening Economy

For the first part of 2017 low volatility equities were outperforming their high beta counterparts. However, as tax reform talk began to look more a reality in late August, high beta stocks resumed their outperformance that really began in early 2016. As the maroon line in the below chart shows, this high beta outperformance is carrying over into the beginning of 2018.


Sunday, January 07, 2018

Sentiment: Simply More Buyers Than Sellers

I am re-reading Justin Mamis' book, The Nature of Risk, a worthwhile read by the way, and being reminded of the dissemination of information prior to the internet age, which is difficult for many to believe if they did not work in investments at that time. Simply gauging market sentiment prior to each day's market open at that time was much different than it is today, of course. As he notes in his book, when one inquired about, say, a higher market, the most appropriate answer was there simply were "more buyers than sellers" that day. In today's proliferation of business cable channels, that type of response will not sell many advertisements.

This focus on buyers and sellers is really an evaluation of investor sentiment and is one reason I write about sentiment reports on a fairly regular basis. To that end, the American Association of Individual Investors reported Sentiment Survey results last week and individual investor bullish sentiment jumped 7.1 percentage points to 59.8%. Most of this bullish improvement came from the prior week's bearish survey participants as bearish sentiment decline 5.1 percentage points to 15.6%. This spike in bullish sentiment can be seen in the below chart.


Saturday, January 06, 2018

Dow 30,000 By Year End

The Dow Jones Industrial Average pushed through 25,000 in the first week of 2018. True to form, the President weighed in on this record and indicated 30,000 is the next target, skipping over the 1,000 increment target milestones. His comment was replayed numerous times on television by the financial media Thursday with many commentators spinning his comment as hyperbole, but might a Dow target of 30,000 in 2018 be reasonable?

The below chart displays the calendar year returns for the Dow Jones Industrial Average going back to 1980. Also included on the chart are red dots representing the largest intra-year drawdown or decline. Looking at the mid 1990's returns, there was a five year period, 1995 - 1999, where the Dow returns ranged from 16% to 33%, but with four of the year's return above 20%. So what would it take for the Dow Index to hit 30,000? A 20% return.


The point being, with the Dow Index trading at a large absolute number level, these 1,000 or 5,000 point moves are not out of the realm of even a reasonable possibility. Just as today a 100 or 200 point decline in the Dow is not a significant drop at all, i.e., less than a tenth half of a percent. Importantly for the market and investors though, is the fact the market has not experienced a double digit pullback since February of 2016, nearly a two year period. The market will experience one of these double digit declines as it did 1997 and 1998, but looking at those prior years, the market can recover and generate strong returns for the entire calendar year period.


Tuesday, January 02, 2018

Equal Weighted Equity Performance Lagged In 2017

One equity market phenomenon that played out in 2017 was the fact larger capitalization stocks were larger contributors to market returns. One way to evaluate this is to review the return of the cap weighted S&P 500 Index versus the equal weighted Guggenheim S&P 500 Index (RSP). As the below chart shows, the equal weighted index underperformed the cap weighted S&P 500 Index by more than 300 basis points. Additionally, the largest 50 stocks by capitalization (XLG) outperformed both the the S&P 500 Index and the equal weighted S&P 500 Index.


Monday, January 01, 2018

Is The Glass Half Full Or Half Empty

The end of Friday trading was certainly interesting as the last thirty minutes of the trading day incurred most of the day's half of a percent loss. A few Twitter posts I read were comments in the vain of "this is the selling I have been anticipating." The market is over due for a pullback.


Sunday, December 31, 2017

Most Read Articles From Our Blog In 2017

Below is a list of the most read blog articles in each month during 2017. One interesting commonality for some of the top posts is the fact the ones focusing on investor sentiment tend to gain higher levels of readership. Sentiment is one important market factor we monitor on a fairly regular basis. Secondly, some prior articles seem to remain applicable as 2018 is set to begin. For example, articles like Market Pullbacks Should Be Expected and The S&P 500 Index Is Expensive and Has Been So Since The Early 1990's are certainly timely even today.

Our firm's bullish equity stance in 2016 and 2017 has certainly rewarded our clients. We are in the midst of finalizing our Winter Investor Letter which will contain some of our firm's thoughts on the coming year.

To our clients and readers, we wish all of you a Healthy and Prosperous New Year.

Second Longest S&P 500 Rally Since 1932 - January 25, 2017

Recent Outperformance Of Low Volatility A Sign Of Risk Off Ahead?
- February 12, 2017

Time To Reduce One's Equity Exposure? - March 1, 2017

Widespread Bearishness Indicating Market Nearing A Turning Point? - April 14, 2017

The Unfortunate Rise Of The Misleading 'Scary Chart' Comparisons Again
- May 29, 2017

Market Pullbacks Should Be Expected
- June 26, 2017

Strong Earnings Growth And Favorable Valuations Lead To Weak Stock Returns - July 22, 2017

The S&P 500 Index Is Expensive And Has Mostly Been So Since The Early 1990's
- August 5, 2017

Stocks Need Some Healthy Competition - September 16, 2017

Citgroup Economic Surprise Indices Have Little Bearing On Equity Market Performance
- October 15, 2017

Individual And Investment Manager Sentiment Is Diverging - November 2, 2017

If Cash Is King - December 19, 2017


Thursday, December 28, 2017

Continued Improvement In Bullish Investor Sentiment

In the few weeks after the 2016 presidential election, individual investor bullish sentiment spiked to near 50%. Over the course of the next five months though, bullish sentiment trended lower to a year low of 23.85%. From March through April the market had some volatile periods that may have influenced investor sentiment; however, true to form this year, the market never experienced a prolonged or significant contraction.


Sunday, December 24, 2017

Dogs Of The Dow Make Up Ground In Second Half Of This Year

Four trading days left until the calendar turns to 2018 and one will be able to determine the list of stocks that will comprise the Dow Dogs of 2018. The Dow Dogs were laggards in the first half of the year, but have made up significant ground in the second half of 2017. To date the Dow Dogs of 2017 have outperformed the S&P 500 Index on a total return basis due to the Dogs higher dividend yield. However, the Dogs of the Dow have underperformed the Dow Jones Industrial Average Index on both a price only and total return basis. The best performing Dow stock that is not included in the Dow Dogs this year is Apple (AAPL) and the stock is up 51.1%.

The Dogs of the Dow strategy is one where investors select the ten stocks that have the highest dividend yield from the stocks in the Dow Jones Industrial Index (DJIA) after the close of business on the last trading day of the year. Once the ten stocks are determined, an investor invests an equal dollar amount in each of the ten stocks and holds them for the entire next year. The popularity of the strategy is its singular focus on dividend yield.


As of Friday's close both Boeing (BA) and Caterpiullar (CAT) will drop out of the Dogs for 2018. The two holdings in the running for inclusion in next year's portfolio are Procter & Gamble (PG) and General Electric (GE) with dividend yields of 2.99% and 2.74%. respectively.


Thursday, December 21, 2017

Small Business Optimism And Equity Market Return One Year Later

When the NFIB Small Business Optimism reading for December 2016 was announced in January, the December reading jumped 7.4 points to 105.8. At that time the optimism reading was the fifth highest reading recorded by NFIB. Prior instances of strong optimism readings were followed by positive stock market returns in the subsequent twelve months. NFIB's Small Business Optimism report last week closed out the subsequent twelve month period from the December 2016 reading and the stock market did not disappoint. As the below chart shows, the S&P 500 Index was up over 18% from December 15, 2016. The market's return was the best performing one out of the other four top NFIB readings. 


As noted in an earlier post, last week's NFIB Small Business Optimism report has the index at its second highest level in its 44-year history.


I will begin tracking the market's performance over the next twelve months and will evaluate the return. If history rhymes at all, 2018 stock market returns would be positive.


Is Optimism Too High?

One of my more regular topics that I write about on the blog from time to time is an update on sentiment measures, both individual and business. Sentiment might be viewed as the third leg of a stool, with the other two being the economy and business financial health or earnings growth. Without positive sentiment from businesses and investors, the economy is more likely to see lackluster growth. What got me to thinking about whether optimism is too high or not was a recent post by Josh Brown whose blog is titled The Reformed Broker.


Tuesday, December 19, 2017

If Cash Is King

Much has been written about the stock market's advance since the end of the financial crisis in 2009. Without getting into the valuation issues, as I have written about that for maybe too many times, the recent return, nearly past two years, has been pretty remarkable and has occurred with a very low level of volatility.


Business and consumer optimism is high, institutional investor optimism is high and individual investor optimism is rising. Almost seems as good as it can get from a sentiment perspective. We know corporations are sitting on a lot of cash with large amounts trapped overseas. The tax bill working its way through Congress is addressing this issue via a change on the taxation of cash held outside the U.S. This increase in corporate cash seems to be an issue that has developed over many years as can be seen in the two charts below. The first chart notes the absolute dollar amount of the cash while the second chart shows corporate cash as a percentage of GDP.


With the passage of a tax reform package, undoubtedly, corporate cash will likely be used in a number of different ways. Recently, Factset reviewed how companies responded to the tax holiday in 2004. Factset's analysis notes:
"In 2003, a combined $30.3 billion in special dividends was paid to shareholders of S&P 500 constituents  this figure jumped to $179.4 billion in 2004, an increase of 492%. In 2005, aggregate special dividends fell to $49.2 billion. Of this $179.4 billion, a collective $149.8 billion (84%) came solely from companies in the GICS Information Technology sector. Notable companies such as Microsoft (MSFT-US) and Motorola (MSI-US) contributed the most to this total. Financials and Healthcare were also top contributors."
And finally, at the end of the day, there will likely be demand for stocks outside of just corporate buybacks. As the below chart shows, both in absolute terms and as a percentage of GDP, household deposits are far above pre-financial crisis levels. As a percentage, deposits are nearly 60% of GDP. If cash is king, individual investors are sitting on potential fuel for the next move higher in equities.


Disclosure: Long MSFT


Companies Begin Highlighting Earnings Benefit From Tax Reform

It seems a day does not go by where the market's valuation is a front and center topic of discussion. Suffice it to say that I believe, and have written as such recently, that the market does not correct simply because it may be trading at an elevated valuation. Although market declines or pullbacks have been few and far between, when the next pullback occurs, a factor in the the magnitude of the decline will likely center on the market's valuation.

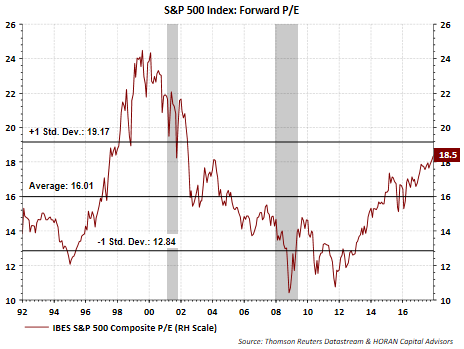
The below chart shows the current market P/E where the earnings are based on the 12-month forward earnings estimate supplied by I/B/E/S. Certainly the P/E is elevated at near a +1 standard deviation level, still the current P/E is quite a bit lower than the technology bubble valuation peak of near 25 times earnings.


Overall earnings growth will be important for the equity market to generate respectable returns in 2018. With passage of a tax reform package nearing realization, companies will benefit from the decline in the maximum corporate tax rate. As an example, tonight FedEx (FDX) reported earnings and noted in the conference call that a lower tax rate will add $.85 to $1.00 to per share earnings. This represents an earnings boost of 8% based on currently expected May 2018 earnings of $12.45 per share. What the tax bill does for many companies is provide an earnings benefit that will result in a reset of the market's valuation to a lower level. The result is the market's valuation is closer to its long run average of 16 to 17 times earnings.

Disclosure: Long FDX


Thursday, December 14, 2017

A Spike Higher In Bullish Investor Sentiment

Today the American Association of Individual Investors reported results of their Sentiment Survey for the week ending 12/13/2017. The report shows individual investor bullish sentiment jumped 8.1 percentage points to 45.0%. 


Most of the jump in bullish sentiment was a result of a 6.1 percentage point decline in bearish sentiment. This has resulted in the bull/bear spread widening to 16.9%, the third widest spread in 2017.


As I have noted in prior sentiment updates, the survey results can be volatile and the 8 period moving average removes the weekly volatility. Additionally, the sentiment measures are contrarian ones and are most useful when they are at their extremes. The current report is not at an extreme level; however, it is elevated and worth paying attention to as the market continues to move higher and exhibit a low level of volatility.


Tuesday, December 12, 2017

A Continued Surge In Small Business And Consumer Optimism

Sentiment for both consumers and small businesses continues to soar. Today the NFIB Small Business Optimism Index was reported at 107.5. I highlighted the surge in consumer sentiment at the end of November.


NFIB notes in its report,
"Not since the roaring Reagan economy has small business optimism been as high as it was in November, according to the National Federation of Independent Business (NFIB) Index of Small Business Optimism, released today." 
“We haven’t seen this kind of optimism in 34 years, and we’ve seen it only once in the 44 years that NFIB has been conducting this research,” said NFIB President and CEO Juanita Duggan. “Small business owners are exuberant about the economy, and they are ready to lead the U.S. economy in a period of robust growth.”
The report also indicates the current reading for November is the second highest reading in the 44-year history of the Index. Some highlights in the report:
  • Job Creation plans increased six points last month, providing more evidence of a strong labor market.
  • The number of owners who said it’s a Good Time to Expand rose four points.
  • Inventory Plans increased by three points.
  • Inventory Satisfaction increased by three points and,
  • Actual Earnings Trend moved up two points.
The significant improvement in sentiment, especially in business sentiment, has been a common theme for the last year. NFIB's report on December 2016 small business optimism saw one of the Index's largest increases. Below is a chart tracking the market's performance since NFIB's last five highest readings from December of last year. This year's market return has been the strongest.


Sentiment is an important part of investing psychology. With both consumer and small business expressing high levels of optimism, it is not surprising equity returns have been as strong as they have been this year.


Sunday, December 10, 2017

Earnings, Not Multiple Expansion, The Key To Favorable 2018 Equity Returns

It seems like an eternity since the S&P 500 Index experienced a pullback of more than 5%. In fact, the last greater than 5% pullback occurred over a year ago during the period of June 8, 2016 to June 27, 2016. This lack of downside volatility has taken place during a nearly uninterrupted increase in the market that began in February last year. Additionally, the market advance since the end of the financial crisis looks remarkable as well. Little or no downside volatility might be understandable if the equity markets were trading sideways this entire time; however, that has not been the case as can be seen below.


Wednesday, November 29, 2017

Strong Corporate Profit Picture A Key Component In Today's GDP Report

Included with today's second estimate GDP report by the Bureau of Economic Analysis is the preliminary estimate for third quarter corporate profits. The corporate profit measure is reported in several different formats, i.e. with and without inventory valuation and capital consumption adjustments. As I noted in a June post, more information on the adjustments can be found can be found in this BEA Briefing Paper (PDF).

The profit growth before tax and with the inventory valuation and capital consumption adjustments equaled 5.4% on a year over year basis. Without the adjustments, year over year profit growth equaled 10%. Importantly, NIPA profits have a nearly 1.0 correlation to IBES S&P 500 forward earnings and historically peak four quarters, or a year before the IBES forward earnings estimate. This preliminary corporate profit report is not signalling a peak in IBES S&P 500 forward earnings.


Also, with the preliminary corporate profit growth figure one can evaluate the NIPA P/E. The growth in NIPA corporate profits has resulted in a slight decline in the NIPA P/E as can be seen in the below chart. As I noted in the June post referenced above, what is useful with the NIPA profit measure is the fact it covers a larger earnings base for the U.S and covers more industries as it is not limited to public companies. Additionally, the NIPA figure makes an effort to adjust for the differing accounting measures being utilized by companies.


By reviewing some of my posts written over the past few months, the lack of any meaningful market pullback has been one recurring theme. However, with the continued strength exhibited in corporate profit growth, the market's path is certainly warranted as stock prices follow earnings. Also, the strong profit picture is beginning to result in a downtrend in the market's NIPA valuation, without a significant correction taking place. That does not mean high valuation equities will not correct more significantly, like what occurred in some technology stocks today. All in all, today's revision higher in Q3 GDP and the prelimnary profit report are both tailwinds for the economy and equity markets, all else being equal.


Tuesday, November 28, 2017

Soaring Consumer Confidence

Consumer confidence soared to a 17-year high in The Conference Board's report today. High levels of consumer confidence tend to translate to an improved retail sales environment as can be seen in the below chart. With consumers accounting for approximately 70% of economic (GDP) activity, today's confidence report portends a positive retail sales environment during the holiday shopping season.


On the other side of the coin though, The Conference Board's third quarter CEO Confidence measure was reported with a slight decline in early October as represented by the green line in the below chart. About two weeks ago we reported on the NFIB Small Business Optimism measure and it declined as well in its recent report; however, small business optimism remains at a high level.


Overall, confidence levels for business and consumers are at relatively high levels and this should be a tailwind for economic activity near term.


Sunday, November 26, 2017

The Sentiment Cycle Phase: "Buy The Dip"

Aside from fundamental market data, the equity market tends to follow a sentiment cycle as described by Justin Mamis, a famed market technician and author, who wrote several books on technical analysis. One of his books, The Nature of Risk, contains a discussion on the equity market's sentiment cycle. Below is The Sentiment Cycle chart included in The Nature of Risk.


In The Nature of Risk Mamis notes the market sentiment cycle begins with stocks climbing the proverbial "wall of worry." In a post I wrote in July 2009, Where Are We In The Market Cycle?, I noted the market seemed to be coming out of the financial crisis and had moved into this "wall of worry" phase of the sentiment cycle. Then in June of 2014 I noted in a blog post, VIX Is Low But Investors In Denial Stage Of Market Sentiment Cycle, I surmised the market was likely in the "denial" phase of the sentiment cycle. Today, I believe we are in or near the "buy the dip" phase of the market sentiment cycle.


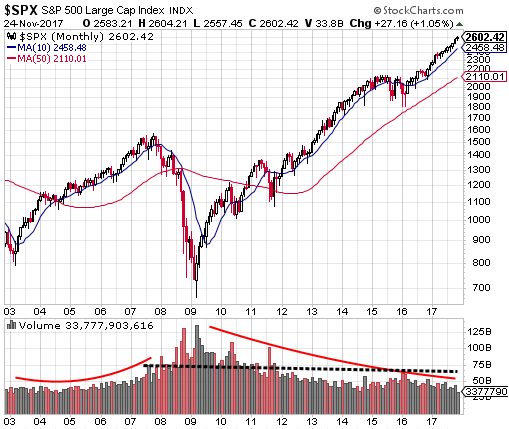
One missing aspect with the market today is the lack of slowly increasing trading volume like occurred in the run up to the market top in 2008 and seen in the above monthly market chart. However, the lack of any significant market pullback since mid year 2016 is certainly representative of investors being content with "buying on the dips."

The sentiment cycle length seems to be an extended one in this bull market cycle and we can list any number of reasons for the extension. However, from a sentiment and technical perspective, this cycle, although long in duration, likely has further upside as buying "enthusiasm" seems absent. A confirming enthusiasm data point would be increasing volume into a so called blow off top.

Lastly, in Justin Mamis' last newsletter, he highlighted The Sentiment Cycle chart and had the following to say about it:
A cycle begins with stocks climbing “a wall of worry,” and ends when there is no worry anymore. Even after the rise tops out, investors continue to believe that they should buy the dips...Unwillingness to believe in that change marks the first phase down: “It’s just another buying opportunity.” The second, realistic, phase down is the passage from bullish to bearish sentiment...Selling begins to make sense. It culminates with the third phase: investors, in disgust,...dump right near the eventual low in the conviction that the bad news is never going to stop…
I think investors would have a hard time arguing against the fact that "buy the dip" is prevalent in recent stock market action. 


Saturday, November 25, 2017

Answering Market Questions Over Thanksgiving

In addition to receiving a few questions about Bitcoin from a few relatives over Thanksgiving, the other common question/comment was "can you believe this stock market, how long can it last." I confess I do not believe in market timing nor do I have a crystal ball; however, that does not mean one should put their head in the sand and ignore important market signals. Aside from the importance of monitoring weekly economic data reports, investors can review a couple of high level data points to gain perspective on the health of the economy and companies broadly. Just as earnings growth is important to evaluate at the company level, market level earnings are important as a rising tide may be lifting all boats. There is truth to the fact that stock prices have a tendency to follow earnings and that is clearly evident in the below chart.


Sunday, November 19, 2017

NFIB Small Business Optimism Index Highlights Tight Labor Market

Last week NFIB's October report on Small Business Optimism fell short of expectations, but remained at a high level at 103.8 versus 103 in the prior report. A few highlights from the report:
  • "The tight labor market got tighter for small business owners last month, continuing a year-long trend. Fifty-nine percent of owners said they tried to hire in October, with 88 percent of them reporting no or few qualified applicants."
  • "Consumer sentiment surged based on optimism about jobs and incomes, an encouraging development as consumers account for 70 percent of GDP," said NFIB Chief Economist Bill Dunkelberg.

And continuing to track the market's performance from December of last year (January's report) when NFIB reported one of the highest NFIB readings, the current S&P 500 Index return is outpacing prior market returns associated with high NFIB readings as seen in the below chart.


With a surge in consumer sentiment and a small business environment that is showing continued strength in hiring, these two factors alone should serve as a tailwind for the economy and market in the months ahead.


Saturday, November 18, 2017

Are Bearish Investor Sentiment Responses Translating Into Actual Action?

The S&P 500 Index is only down .60% from its November 8, 2017 high yet individual investor and institutional equity sentiment has turned significantly less positive. This negative sentiment has not translated into broadly lower equity prices though, but knowing sentiment measures are contrary indicators, they are approaching levels that would be suggestive of higher equity prices ahead.


Sunday, November 12, 2017

Equity Corrections Will Occur Again, Maybe Sooner Than One Expects

If there is one factor that perplexes me about the current market environment it is the lack of volatility since the election. The last time the market experienced a greater than 5% correction was in June of 2016 and the last double digit pullback was in February 2016. Going back to 1980 the average intra-year market decline for the S&P 500 Index is 14.1%. I have written a number of recent posts on the positive global economic environment, at the risk of sounding like a broken record, that may be serving as a tailwind for equity market returns around the world.

On the surface, if one knew mutual funds were holding elevated cash positions, they might conclude that this is a bullish data point since the cash can be deployed in additional equity investments. On the other hand, elevated liquidity in equity funds may be a sign of investors rapidly allocating more funds to equities and this might actually be a negative sentiment measure. In fact, as the below chart shows, there is a high correlation to elevated liquidity in equity funds and market tops.


Friday, November 10, 2017

If History Repeating; Another Five Years For Equity Bull Market

Shortly after the 2016 election in a post titled, Equity Market Beginning To Resemble Bull Market Of The 1950's And 1980's, I discussed how the equity market continued to trace a similar path as the market in the those two earlier decades. A part of my conclusion indicated the anticipated policies under a Trump administration would resemble policies implemented in the 1950's and 1980's, like tax reform and infrastructure spending. Reality is setting in and not much seems to be getting done in Washington on those two fronts; however, the current market continues to follow a similar path as in the 50's and 80's. Better sentiment and regulatory reform, even though by executive order, seems to be having a positive influence on companies. If the past is any guide then, the bull market might have at least another five years to run as can be seen in the below chart.


Thursday, November 09, 2017

Biases Influence Investment Decisions

Every investor makes investment decisions that are influenced by ones biases that form over time. These biases may come in many forms but they tend to fall into a couple of categories, emotional or cognitive. I mention this because it is not that uncommon that I sit down to write a blog post on a certain topic thinking the post's conclusion will go in one direction, but end up with a different conclusion after evaluating some of the research. Some of these blog topics are developed by flipping through a lot of charts, which I do frequently. One such chart is below and shows the relative performance of the S&P 500 Dividend Aristocrats to the S&P 500 Index.


Monday, November 06, 2017

Investment Opportunities Outside The U.S.

In a post yesterday I somewhat rhetorically titled the post wondering if the equity market was at a top. In short, I do not know, but offered suggestions for investors about reviewing their asset allocation vis-à-vis their spending needs.

Not all markets have traveled the same path as the S&P 500 Index though. A number of markets outside the U.S have lagged the U.S. since the end of the financial crisis. The below chart compares the cumulative performance of the S&P 500 Index (SPY) versus the MSCI ACWI ex U.S Index (ACWX). The chart goes back to the beginning of 1992 and clearly the S&P 500 has a performance advantage with a widening gap beginning to develop around 2011.


Sunday, November 05, 2017

Is This The Market Top?

I read an individual's commentary this weekend that was titled Is This As Good As It Gets, and I will have more comments on this later in this post, but it coincides with some clients/investors inquiring whether they should raise cash now. The 'raise cash now' question is certainly understandable when one looks at the strength of the market since the February low last year, up nearly 40% on a price only basis in less than two years.


Thursday, November 02, 2017

Individual And Investment Manager Sentiment Is Diverging

At the end of August bullish investor sentiment reached a year low of 25% and since that time individual investor sentiment has risen to 45.1% as reported by the American Association of Individual Investors (AAII) today. During this time period the S&P 500 Index has increased nearly 5%, providing some support to the contrarian nature of the individual sentiment report.


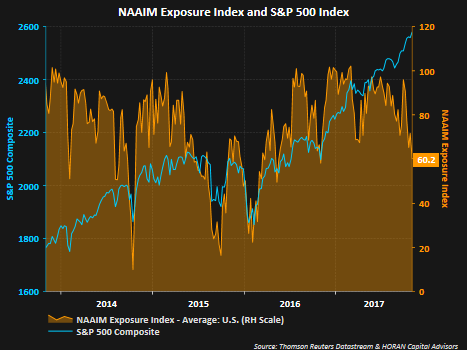
Conversely, the National Association of Active Investment Managers reported a decline in their Exposure Index to 60.2% from 71.7% in the week earlier. As noted by NAAIM, the Exposure Index,
"is not predictive in nature and is of little value in attempting to determine what the stock market will do in the future. The primary goal of most active managers is to manage the risk/reward relationship of the stock market and to stay in tune with what the market is doing at any given time. As the name indicates, the NAAIM Exposure Index provides insight into the actual adjustments active risk managers have made to client accounts over the past two weeks."

Nonetheless, investment managers are positioned for a less constructive bullish market while the individual investor seems more optimistic from a sentiment perspective. One should keep in mind these sentiment measures are most predictive at extremes and it can be argued neither the AAII sentiment reading nor  the NAAIM Exposure Index is at an extreme level. However, sentiment expectations for institutions and  individuals are moving in opposite directions and both will not be right.