Saturday, July 25, 2015

Weakening Sentiment Negatively Impacting Consumer Spending

The IBD/TIPP Economic Optimism Index reported this month continues to indicate weak individual optimism. For July the IBD/TIPP Economic Optimism Index was below the neutral 50% level for the third consecutive month.

From The Blog of HORAN Capital Advisors


In addition to weakness seen in the TIPP Index, IBD notes, "the Six-Month Outlook Index fell for a third straight month, sinking 0.8 point to 44.5. That's the lowest since last September."

From The Blog of HORAN Capital Advisors
Source: IBD

In July, Confidence in Federal Economic Policies did increase three points to 44.2, but remains below the neutral 50% level. The TIPP Index is comprised of three components.
  • The Six-Month Economic Outlook: a measure of how consumers feel about the economy’s prospects in the next six months.
  • The Personal Financial Outlook: a measure of how Americans feel about their own finances in the next six months.
  • Confidence in Federal Economic Policies: a proprietary IBD/TIPP measure of views on how government economic policies are working.
The weakness seen in this sentiment measure has carried over into other sentiment reports. The  University of Michigan Consumer Sentiment Index reading, reported a week ago, fell to 93.3 versus the prior reading of 96.1. Econoday notes, "consumer sentiment has been running very strong most of this year and often well ahead of consumer spending readings which have been flat. But today's report (July 17th) suggests that the best for confidence may already have passed (emphasis added.)

The consumer sector seems to be more discerning in its spending resulting in a decline in the change in personal consumption expenditures and a commensurate increase in the savings rate (purple line in second chart below.)

From The Blog of HORAN Capital Advisors

From The Blog of HORAN Capital Advisors

A result of what seems like a pullback in consumer spending is business and retail inventory to sales ratios continue to increase. Some of this build is a result of an inventory build following the disruptive issues in the first quarter. However, with a slowdown in consumer spending and potential slowing in inventory build in the economy, these two factors will have negative implications for GDP growth in the second quarter.

Lastly, earnings reports for Q2 have, so far, exceeded analyst lowered expectations. Thomson Reuters notes through July 24th, 77% of companies have reported positive EPS surprises; however, only 52% have beat on revenue. The consumer seems to have weakened through the second quarter. With the consumer accounting for about 70% of economic activity, a more positive consumer will be needed to provide economic strength in the second half of the year. Oil prices seem to be taking another leg down with many commodities following suit. These lower energy prices should begin to show up in lower gasoline prices as well and may be necessary to stimulate consumer confidence and consumer spending.


Friday, July 24, 2015

Market Correcting Over Time By Trading Sideways Versus Steep Price Drop

Since February the S&P 500 Index has essentially traded sideways within a 4.8% trading range. This sideways market movement may be resulting in a trading pattern where the market is correcting over time versus correcting with a steep price drop. A sideways market correction enables earnings to catch up to the market's price. As the below chart shows, several of the technical indicators suggest the future market direction is one where the price could trade to the bottom of this trading range highlighted by the yellow box on the chart.

From The Blog of HORAN Capital Advisors

A closer view of the market, as provided by Charles Kirk of the The Kirk Report, shows there are three additional gaps the market may attempt to fill that will take the index level to the lower end of this trading range. His commentary included with his technical analysis notes,
"As shown in the chart [below], the S&P filled the first lower gap, tested and bounced from the 38.2 fibo, and then closed right at first support at the 50 day at S&P 2102. This is seen by many as an important support level that if not defended will soon bring the three other lower gaps into play as trade to targets."
From The Blog of HORAN Capital Advisors

One question is what factors will cause the market to trade to the upside and out of this trading range? One fundamental factor is that of company earnings growth. Recent earnings reports have generally beat analyst expectations, yet S&P 500 earnings growth for Q2 is expected to decline about 2%. Top line revenue results have been weaker than expectations in Q2, with companies citing headwinds from the stronger US Dollar. A positive is the energy and currency headwinds will begin to subside in Q3 and especially in Q4 and Q1 of 2016 as these headwinds are lapped in the year over year comparisons. In Q4 2015 and Q1 2016 earnings growth is expected to be about 4% and 9%, respectively. This better earnings growth could be a catalyst for higher equity prices beginning later in Q3 and into 2016.


Thursday, July 23, 2015

Neutral Sentiment Investors Are More Bearish Than Bullish this Week

An interesting facet of the American Associations of Individual Investors Sentiment Survey has been the recent long streak of an above 40% reading for the neutral sentiment category. This week represents a record 16th straight week with the neutral reading above 40%. Although the neutral reading remains high, this week it did fall from last week's 45.95% to 41.87%. More of these neutral investors have now become more bearish as the bearish sentiment reading increased 2.36 percentage points to 25.60%, whereas the bullish sentiment reading increased a lesser 1.73 percentage points to 32.54%.

As the below chart shows, bullish sentiments remains at a relatively low level, near 1 standard deviation below its long run average. Additionally, the second chart below shows the 8-period moving average of the bullish sentiment reading and it remains near its lowest level since the end of the financial crisis six years ago.

From The Blog of HORAN Capital Advisors

From The Blog of HORAN Capital Advisors
Data source for charts: AAII


Wednesday, July 22, 2015

Investor Letter Summer 2015: Countries/Territories Unable To Pay Their Debts

In our recently published Summer 2015 Investor Letter we highlight issues impacting the market in the first half of the year. In the second quarter the world was not short of market influencing events as Greece, China and Puerto Rico all dominated the headlines.  The second quarter proved to be another challenging quarter partially due to these events and volatility erased much of the year’s gains. However, U.S. economic data was certainly a bright spot as positive reports provide some optimism as we enter the second half of 2015.  Beginning in the third quarter, the headwind resulting from the strong US Dollar and energy weakness should begin to subside and make year over year comparisons more normalized.

Also, we welcomed two new employees to our investment team in the quarter:

Senior Portfolio Manager, Todd Poellein, CFA
Todd joins HORAN Capital Advisors with over 10 years of portfolio management experience and nearly 20 years of industry experience. Todd graduated from the Kelly School of Business at Indiana University and spent a number of years at PricewaterhouseCoopers and Fifth Third Bank. He holds the Chartered Financial Analyst (CFA) designation and will bring great value to our client relationships with his knowledge of portfolio construction, security analysis and long-term planning.

Investment Associate, Matthew Woebkenberg
Matt is a recent graduate of the University of Notre Dame where he carried high honors while majoring in Finance and Spanish. Matt is already pursuing his CFA designation and will take Level I this December. Matt will support the portfolio managers at HORAN Capital Advisors and we look forward to his contributions.

For additional insight into our views for the market and economy, one can read our Investor Letter accessible at the below link.
From The Blog of HORAN Capital Advisors


Monday, July 20, 2015

Weak Market Breadth But Equity Valuations Not Extended

Recent market commentary has highlighted the weak market breadth in spite of the equity market's continued move higher. Weak market breadth refers to the technical situation where more equity issues are declining than rising. This weakness raises a red flag in an environment where breadth is negative and the equity market continues to move higher. Below are a couple of charts and article links noting the weakness and subsequent returns when this occurred in the past.

From The Blog of HORAN Capital Advisors
Source: Dana Lyons

From The Blog of HORAN Capital Advisors
Source: Ryan Detrick

Certainly, the breadth technical picture is something investors should continue to evaluate. However, what is equally, if not more important, are company fundamentals and the valuation level of the overall market. Below are a couple of charts on two market sectors that have attracted a lot of investor attention this year.

The first chart compares the S&P GICS Technology Sector to the forward P/E for the 67 companies that currently make up the sector. As can be seen from the chart, valuations are no where near the sector valuation reach prior to the tech bubble bursting in 2000. In 2000 the PE reached nearly 50 for the sector where today the sector is trading at a PE multiple of just under 15 times earnings.

From The Blog of HORAN Capital Advisors

Another sector that continues to attract investor interest is biotechnology. As the below chart for this sector shows, the biotech index (8 companies) has risen significantly since 2012. In spite of this sustained move higher, the sector PE is just over 17, far below the 2000 peak of 63.

From The Blog of HORAN Capital Advisors

Lastly, even the broader S&P 500 Index itself is not trading at the technology bubble level reached in 2000. The current forward PE is 17 versus the 2000 peak of 24. The current PE is just slightly above its long term average.

From The Blog of HORAN Capital Advisors

The weak market breadth is a variable investors might want to track, keeping in mind market valuations are far below the levels reached in early 2000. A critical variable will be corporate earnings looking out for the next four quarters. Companies  have begun reporting their second quarter results (60 companies reported through 7/17). Earnings growth for the next four quarters is projected to back-end loaded. Thomson Reuters I/B/E/S is estimating Q2 2015 through Q1 2016 quarterly earnings growth will equal: -2%, -1%, 4% and 9%.

And finally, just a brief comment on individual investor sentiment, which we also review in our just completed Summer Investor Letter. AAII individual investor bullish sentiment was reported at 30.8% last week, which is nearly one standard deviation below the average bullish sentiment level. Two weeks ago the bullish sentiment reading fell to a low 22.6%. This low level of bullishness reported by individual investors is a contrarian indicator. Could the market be positioning itself for a rally to finish off the summer? Ryan Detrick wrote an article today, Investor Sentiment: Why A Market Correction May Be Slipping Away, that provides a good analysis of other sentiment indicators and what these indicators might suggest for market performance in the coming months.


Tuesday, July 14, 2015

Was Today's Twitter Buyout Hoax An Indication Of An Overvalued Market?

The Twitter (TWTR) buyout offer hoax this morning have some believing this is an indication the market is trading at an overbought level. The thinking is investors are taking trading positions based on rumors versus evaluating company facts and company fundamentals. Mark Hulbert, a senior columnist at MarketWatch and the editor of the Hulbert Financial Digest, published an article late this afternoon, Why the Twitter Hoax Suggests the Market is Near a Top.

In the article he notes, " ...investors are increasingly resorting to betting on rumors as they become unable to find stocks that represent genuine long-term value." Mark Hulbert may certainly be right in noting the market is at a top; however, and equally or more important is the analysis of specific stock and market fundamentals. Broadly, from a market perspective, the valuation or price earnings ratio (P/E) of the market, does not seem indicative of an extremely overvalued market. The excellent J.P. Morgan Guide to the Market, contains a P/E chart for the S&P 500 Index that shows the forward S&P 500 P/E is just above the long term average P/E going back to 1990. Other valuation measures detailed in the below chart also are not indicative of an extremely overvalued equity market. For sure though, the easy money seems to have been made since the end of the financial crisis over five years ago, in the U.S. anyway.

From The Blog of HORAN Capital Advisors

Other technical market indicators also seem to indicate the market is, at a minimum, in a short term oversold level and beginning to move to a higher level. As can be seen in the below chart, the S&P 500 Index has found support at its 200 day moving average and is beginning to move higher over the last three days. Also, the MACD and stochastic indicators have turned positive from oversold levels as well.

From The Blog of HORAN Capital Advisors

Lastly, the percentage of S&P 500 stocks trading above their 50 and 200 day moving averages recently reached levels indicative of a short term oversold market and are now moving to higher levels as the S&P 500 moves higher too.

From The Blog of HORAN Capital Advisors

From The Blog of HORAN Capital Advisors

In investing nothing is a certainty; however, the potential resolution (kick the can) of the Greece situation seems to have eased some of the near term anxiety of investors for the time being. As second quarter earnings season unfolds, a potemntially clearer picture on the business environment will be forthcoming.


Thursday, July 02, 2015

Sharp Decline In Investor Sentiment

The American Association of Individual Investor's sentiment survey release this morning shows bullish sentiment fell nearly thirteen percentage points to 22.6% The previous week bulls switched to the bearish camp with bearish sentiment increasing 13.4%. The bull/bear spread is now -12.5%. As a reminder, this contrarian sentiment measure can be volatile from week to week and is most predictive at its extremes.

From The Blog of HORAN Capital Advisors
Source: AAII


Monday, June 29, 2015

Equity Put/Call Ratio Jumps To Near 1.0

It seems as though the Greece situation has been one that has been ongoing for years and was the cause for today's market decline and jump in the equity put/call ratio to .94 from .54 on Friday. As we noted in a May post in 2012, a spike in the put/call ratio to .99 was partly caused by "the lack of confidence in Europe handling its sovereign debt issues." Nearly three years later the same issues are again challenging investors. For investors, the equity put/call ratio...:
...measures the sentiment of the individual investor by dividing put volume by call volume. At the extremes, this particular measure is a contrarian one; hence, P/C ratios above 1.0 signal overly bearish sentiment from the individual investor.
From The Blog of HORAN Capital Advisors

When countries live and spend beyond their means, an unlimited supply of funding eventually drys up. The contagion concern is associated with countries like Spain, Portugal and Italy. In the U.S. Puerto Rico has now become an issue and broadly, the U.S. is living far beyond its means which needs to be addressed sooner versus later.

In the near term though, the markets sometimes become disconnected and sentiment does suggest an overly bearish investor when looking at the put/call ratio. Other individual investor sentiment measures also are bearish (AAII bullish sentiment.) Overly pessimistic sentiment indicators are contrarian indicators and are indicative of potential market bounces. 


Sunday, June 28, 2015

Equity Market Performance Around Crisis Events

With Greece headlines dominating news stories over this past weekend, investors might be on edge regarding future equity market returns on Monday and the coming weeks. A number of headlines this evening are using the words plunge and slide as U.S. futures are down less than 1.5%. Yes, much can change before the U.S. markets open Monday morning, but it is the sensational headline that generates reader clicks and article views. I have written several times over the past few years about these shocks to the equity market and how the market damage generally has been short lived, (here and here.)

S&P Dow Jones Indices published a report in September 2013, Shocks & Stocks, that analyzed market shocks and the initial market decline and the time necessary to recover the losses. Included in the report is the below table.

From The Blog of HORAN Capital Advisors

As can be seen in the above table, of the fourteen shock events listed, the average market decline was 5.3% and losses were recovered in an average of 14 days. Several of the losses were much greater than the average and the recovery time period much larger than the average. S&P notes though,
  • "Granted, even though selected events took much longer to play out than the medians would suggest, these extreme situations usually occurred within the confines of a long-term bear market and did not precipitate the initial decline. Examples of these include: 1) Pearl Harbor, 2) President Nixon’s resignation, 3) the terrorist attacks on 9/11, and 4) the collapse of Lehman Brothers. So should history repeat itself, and there is no guarantee it will, unanticipated events that occur within bull markets that throw markets for a loop are typically assessed for their economic impact in short order, allowing opportunistic traders to step in and quickly push share prices back to break-even and beyond."
A a word of caution for investors wishing to sell stocks early Monday morning, remember, these crisis events generally have a short lived impact on the return in equity indices.


Thursday, June 25, 2015

Companies Continue To Enhance Earnings Per Share Via Stock Buybacks

S&P Dow Jones Indices released first quarter 2015 buyback detail for the S&P 500 Index. On a year over year basis, buybacks declined 9.5%. In conjunction with the YOY decline in buybacks, YOY operating earnings declined 6.3% and as reported earnings declined nearly 13%. Important in the buyback report is the fact 20% of S&P 500 companies reduced their share count by at least 4%. This share count reduction enhances reported earnings per share and investors need to be aware of the artificial growth in EPS that results from this activity.
From The Blog of HORAN Capital Advisors


Saturday, June 20, 2015

Better Investing Members' Most Active Stocks As Of June 20, 2015

Better Investing Magazine maintains a list of most active stocks as reported by their members. From time to time I highlight recent activity. Below is the list of most active stocks as of June 20, 2015. Most of the active stocks on the list are experiencing more buying than selling. Two issues, Qualcomm (QCOM) and Ford (F), are experiencing the most selling pressure as reported by BI's members.

From The Blog of HORAN Capital Advisors


Disclosure: firm zand family long AAPL, QCOM


EURO STOXX 50 VIX At Record Wide Spread Versus S&P 500 VIX

The VIX index is a measure of volatility and a higher VIX reading is associated heightened investor fear. Because this index is know as the fear index, a higher VIX reading is viewed as a contrarian indicator. In late 2008 the VIX hit a level of near 90% as compared to today's reading of about 14%. Shortly after this high reading the S&P 500 Index reached a bottom and has been on a march higher since.

VIX measures are available for other markets outside the U.S. and one getting some attention at the moment is the EURO STOXX 50 VIX. As the below chart shows the VIX for the EURO STOXX Index has widened to a historically wide level versus the S&P VIX. This widening is likely the result of concern around the consequences of the resolution of the issues in Greece issues and the potential impact on European markets.

From The Blog of HORAN Capital Advisors

As can be seen in the above chart, the average spread between the VIX and EURO STOXX VIX is 3.78% and the current spread is 14.95%. The current reading places this spread difference in the 99 percentile over the last ten years.

For investors then, the question becomes how this spread differential gets resolved. Is the ultimate resolution in Greece a "kick the can" one which is likely viewed favorably by the market or is the future path one where Greece is removed from the Euro Zone? Can Hui, CFA wrote an insightful article covering potential outcomes for Greece and how investors can take advantage of the results in an article titled, Two ways to Play Greece. One important distinction for readers in the article is the two ways to play the Greece situation depends on whether one is a trader or an investor. 


Tuesday, June 16, 2015

Stock Investors Should Hope 2015 Is A Repeat Of 2013

Market similarities comparing this year to 2013 are beginning to rise to the forefront of investors' minds. For equity investors, let's hope 2015 is a repeat of 2013. In 2013 the bond market experienced a "taper tantrum" as the Fed was preparing to end its quantitative easing programs. From early May 2013 to mid September the 10 year US Treasury yield rose from 1.7% to 2.9%. On an absolute basis, this is a significant rise in interest rates and caused bonds to selloff.. The iShares 20+ Year Treasury Bond ETF (TLT) fell over 17% from May 2013 to year end 2013.


Sunday, June 14, 2015

Dow Theory Has Many False Signals

One technical market indicator that has gained quite a bit of focus recently is the weakness in the transport index (IYT) relative to the Dow Jones Industrials Index (DJIA). Dow Theory suggests that underperformance in the transportation sector of the market is a precursor to broader weakness in the Dow index.

From The Blog of HORAN Capital Advisors


Saturday, June 13, 2015

Low Bullish Investor Sentiment Generally Leads To Strong Forward Returns For Stocks

This past week the American Association of Individual Investors reported bullish investor sentiment declined over seven percentage points to 20.04%. This is the lowest sentiment reading level since April 11, 2013 when bullish sentiment was reported at 19.31%.

From The Blog of HORAN Capital Advisors
Data source: AAII


Monday, June 08, 2015

High Quality Stocks Hold Up Better In Broad Equity Market Corrections

Just two weeks ago I wrote an article focusing on investment risk and market corrections, Incurring Investment Risk Near A Market Correction. The "correction" thinking seems to remain high on many investors' and strategists' minds. From a contrarian perspective, market corrections are difficult to time and corrections rarely occur when everyone expects them to. This article is falling into the same line of correction thinking, maybe a trap of sorts; however, the following thoughts will touch on an equity strategy that historically has held up better in declining equity market environments.


Sunday, May 31, 2015

Share Buyback Investment Strategy Beginning To Underperform Broader Market

One market phenomenon noticed by many investors has been the elevated use of excess cash flow by companies to fund stock buyback programs. The demand for these buyback oriented equities has resulted in their significant outperformance versus the broader S&P 500 Index as can be seen in the below chart.

From The Blog of HORAN Capital Advisors

The U.S. equity market bottomed in March of 2009 following the financial crisis. From Q1 2009 through Q4 2014, S&P 500 companies have spent $3.8 trillion on dividends and buybacks. Reported earnings over this same time period totaled $4.5 trillion. As a result companies used 84% of their earnings to fund these dividend and buyback programs. Understandably, companies repurchased shares in the 2009 - 2012 period when share prices were depressed; however, accelerating buybacks at this point in time may be causing investors to rethink exposure to high buyback oriented firms. Since April the buyback index (PKW) has been underperforming the S&P 500 Index as can be seen in the following chart.

From The Blog of HORAN Capital Advisors

Lastly, as I noted in a post several years ago, firms have a tendency to buyback shares when stock prices are near highs. This fact may be causing investors to turn more cautious on companies buying back shares in an environment where some stocks may be trading at elevated valuation levels.


Friday, May 29, 2015

Lower Oil Prices Ahead?

On Thursday the EIA Petroleum Status Report shows a fourth week of oil inventory draw-down with a decline of 2.8 million barrels. Expectations were inventories would decline 857,000 barrels.

From The Blog of HORAN Capital Advisors

This decline occurred in spite of the continued increase in production as noted by the orange line in the below chart. Notable in the chart is the fact production continues to increase in spite of the sharp drop in rig count (blue line). The recent inventory draw-down may be due to seasonal factors as the busy summer travel season approaches as well as temporary production declines in sand fields in Canada.


Tuesday, May 26, 2015

Today's Market Decline Does Not Qualify As A Correction

The S&P 500 Index is down 1% today and much of the television media represent this as a market "plunge". A representative headline on CNBC notes:
As the below chart shows, the S&P 500 Index is down only 1.29% from its year-to-date high return of 3.49% reached on 5/21/2015. For the the Dow Jones Industrial Average, this index closed down almost 200 points today; however, as the market index value becomes a larger number, 100 or 200 point movements are not significant from a percentage return basis.

From Blog of HORAN Capital Advisors 5 2015


Monday, May 25, 2015

Incurring Investment Risk Near A Market Correction

One issue on the minds of a number of investors is the near term potential for an equity market correction. One's thinking is framed by the fact the S&P 500 Index has not incurred a 10+% correction in three and a half years or 916 trading days. This is the third longest streak as can be seen in the below chart. Include the fact first quarter 2015 earnings were not that great from a growth perspective, the economy (GDP) is growing at a snails pace and euro zone issues (Greece and now maybe Spain), it is not surprising investors are a little on edge.

From Blog of HORAN Capital Advisors 5 2015


Sunday, May 24, 2015

Divergent Performance Between Transports And Industrials Likely Not Indicating Broader Economic Weakness

The disconnect between the performance of the Dow Jones Industrial Index and the Dow Jones Transportation Index has some market strategists suggesting the broader equity market is setting the stage for a correction. The correction thinking is based on the theory that weakness in transports is indicative of less goods being moved in the economy and thus a signal of a slowing  economic environment. From a more technical perspective, some strategist look at the Dow Theory as being able to signal a market correction.

As the below chart shows the transportation index has underperformed both the Dow Jones Industrial Index and the broader S&P 500 Index. This underperformance began to accelerate in mid-March. For investors though, evaluating the actual causes of weakness in the transports will provide insight into the slowing rail segment of the market and whether these factors are broad based ones or simply industry specific ones.

From Blog of HORAN Capital Advisors 5 2015


Wednesday, May 20, 2015

Bonds Performed Poorly Leading Up To Release of Fed Minutes

In our last post about a week ago we noted the slow pace of economic growth that has unfolded since the financial crisis. This slow pace of growth has resulted in the unprecedented easing programs (quantitative easing-QE) instituted by the Federal Reserve over the past few years. A consequence of these QE programs is the apparent inability of the Fed to embark on a monetary tightening path since the markets seem addicted to these programs. In our view, given the low level of rates today, an initial tightening by the Fed will not have a long lasting negative impact on the overall economy or equity market. With this said, market participants were looking for insight into the Fed's future monetary direction with the release of the Fed's most recent meeting minutes. As was true to form, the Fed seems intent on maintaining its near zero interest policy with a June rate hike most likely pushed back to later in 2015 or maybe 2016. This delay in raising rates may give the market a reason to push bond prices higher (interest rates lower) near term.

Leading up to the release of the April minutes, the bond market positioned itself for a potential rate hike in June. As the below chart shows, from the beginning of April through the market close on May 19th, treasury bond ETFs sold off significantly. The aggregate bond index was also a weak performer and traded down nearly 2%. Stocks (S&P 500 Index) on the other hand have generated a positive 3.2% return since April 1st.

From Blog of HORAN Capital Advisors 5 2015


Monday, May 11, 2015

Anemic Economic Growth Since The Great Recession And Some Causes

The March trade deficit grew to $51.4 billion which has many economist now predicting subsequent revisions to first quarter GDP will show the economy contracted for the first time since contracting -2.1% in the first quarter of 2014.  In the first quarter the advanced reading on GDP or economic growth was reported at .2% which was below an expectation of a Q1 growth rate of 1%. The large increase in the trade deficit is being attributed to resolution of the West Coast labor dispute resulting in a spike in imports and to U.S. export headwinds due to the strong dollar.

From The Blog of HORAN Capital Advisors


Wednesday, May 06, 2015

Dividend Paying Stocks Struggling Mightily

In a post last month we highlighted the fact value strategies and dividend paying strategies were lagging both the S&P 500 Index and the S&P 500 Growth Index over the past twelve months. Frequently the value type stocks have a dividend component that provides additional return for investors.

Further confirmation that dividend paying strategies have been underperformers can be seen below. S&P Dow Jones Indices reports the average performance of the dividend payers in the S&P 500 Index have lagged the non payers by a wide margin, both year to date and over the course of the past twelve months as of April 30, 2015. For the one year period the payers return of 12.85% falls far short of the non-payers return of 20.64%.

From The Blog of HORAN Capital Advisors


Wednesday, April 29, 2015

Stock Buybacks Are Not A Primary Factor In Lower Wage Growth Rates

Recently, a number of articles have been circulating about the need for companies to use more of a firm's cash flow to pay employees a higher wage versus using the cash flow growth to fund stock buybacks. For example,
  • How the Stock Market Destroyed The Middle Class (MarketWatch)
  • Stock Buybacks Are Killing the American Economy (The Atlantic)
  • Profits Are Up, But Wages Are Stagnant. This Senator Has A Plan (ThinkProgress)
The implication in a number of the articles is stock buybacks increase a company's stock price and therefore buybacks are being used to increase the value of senior management stock options. In short though, buybacks have no direct impact on the value of a company's stock price. The below table shows how the share price is unchanged. What can occur is the earnings per share figure can increase due to the lower share count. Other  examples are contained in our post, Proof Buybacks Impact Earnings Per Share. We believe the market is intelligent enough to see through this type of earnings manipulation; thus, not attaching additional value for a firm's stock price due solely to stock buyback activity.

From The Blog of HORAN Capital Advisors


Friday, April 24, 2015

A Further Rise In Crude Oil Prices Facing Headwinds Near Term

Oil rig count has fallen dramatically in the U.S., yet oil supply is continuing to pile up nearly unabated. The market is of the belief that this decline in rig count will ultimately put a halt to the supply growth.

From The Blog of HORAN Capital Advisors

Rex Tillerson, CEO of Exxon Mobil (XOM), recently spoke at the IHS CeraWeek conference in Houston, TX. Tillerson believes oil prices are likely to remain at a lower level for the next several years. Additionally, ConocoPhillips (COP) CEO noted the shale fracking industry has a large number of wells that will be completed once oil prices do rise. This alone is likely to place a cap on the rise in the price of oil.

Lastly, as the below chart clearly shows, in spite of the lower level of oil prices, Saudi Arabia is determined to keep the supply of oil flowing as evidenced by the country's rig count growth (green line.) Their goal is to force fracking companies out of business in an effort to eliminate this swing supply.

From The Blog of HORAN Capital Advisors

With WTI recently rebounding from the mid $40 per bbl price to mid $50's level, further oil price increases could face some headwinds in spite of the decline in global rig count (red line.) In the EIA Petroleum Status Report released on Wednesday, crude oil inventories rose 5.3 million barrels. As noted by Econoday,
"The string of inventory builds continues for oil, up a fat 5.3 million barrels in the April 17 week to 489.0 million which is the 14th straight build and yet another 80-year high [emphasis added]. The build is due to yet another rise in oil imports and also in part to an easing of refinery demand for oil. But refineries are still busy, operating at 91.2 percent of capacity."


Thursday, April 23, 2015

Investor Letter Spring 2015: Another Weak First Quarter?

The first quarter of 2015 once again was a period where reported data suggests a mixed economic picture for the global economy. Interest rates declined slightly leading to positive returns for nearly all U.S. bond market segments. This was once again influenced by lower yields outside the U.S. and the strengthening Dollar. Worries about an economic slowdown have resulted in Europe, Japan and China incorporating additional economic stimulus via interest rate decreases and bond purchase programs. For many investors, the prospect of weak economic news is good for equity markets as central banks pursue stimulus programs to reinvigorate economic growth. Stimulus seems to create a floor for equity markets as liquidity finds its way into the market.

As we noted in our blog post yesterday, Higher Yield and Value Oriented Strategies Underperforming Broader Market, the additional investor demand for these yield oriented equities, i.e. dividend growth stocks, has not resulted in higher returns. Also, Goldman Sachs notes in a recent report that the dividend yield, high quality and strong balance sheet companies have been weaker performers versus other more growth oriented strategies. The below charts provide evidence of this phenomenon.

From The Blog of HORAN Capital Advisors

Looking specifically at economic growth or GDP, the Federal Reserve Bank of Atlanta notes the weakness in GDP in each first quarter since 2010. Some attribute this first quarter weakness to poor weather. However, the Atlanta Fed notes seasonal adjustments since the Great Recession could be negatively influencing first quarter GDP reports as well. As the chart at left shows, weaker economic activity in the first quarters since 2010 is very apparent. The average GDP growth in the first quarter since 2010 has been .6% versus 2.9% for the remaining quarters of the year. The advance estimate for the first quarter of 2015 will be reported on April 29th and the Fed’s tracking of data shows Q1 2015 GDP at just above zero.

For additional insight into our views for the market and economy, one can read our Investor Letter accessible at the below link.

From The Blog of HORAN Capital Advisors


Wednesday, April 22, 2015

Higher Yield and Value Oriented Strategies Underperforming Broader Market

One interesting aspect of the recent equity market advance has been the investor focus on higher quality dividend growth equities. A result of investors' search for yield is many of these higher yielding equities are trading at the higher end of their historical valuation range. Also, given the heightened focus on yield, one would expect the higher quality dividend growth equities to have outperformed the market over the past year. However, as the below chart shows, the SPDR Dividend ETF (SDY) has generated the worst 1 year return versus the other three comparison investments. The second worst performer is the S&P 500 Barra Value Index.

From The Blog of HORAN Capital Advisors

Although investors have pursued higher yielding investments in this low yield environment, the higher demand has not resulted in higher returns. The underperformance of higher quality and higher yielding investments may be a shorter term phenomenon, but investors simply need to be aware that pursuing higher yield/higher quality strategies can result in lagging performance if only in the short run. On the other hand, in a market correction higher quality and higher yield equities tend to outperform the overall market.


Sunday, April 19, 2015

Is This The Beginning Of A Larger Equity Market Correction?

Awaiting the 10% equity market correction seems to be on the minds of a number of strategists as soon as the market begins a turn lower. The last correction of greater than 10% occurred in 2011 when the S&P 500 Index declined nearly 20% between July and October 2011.

Since March 23rd through Friday's close, the S&P 500 Index has declined 43 points to 2,072 or a decline of just 2%. In the first week of March, the S&P fell 3.5% before rebounding. An important support level has been the 50 day moving average; however, when this level is violated, the 150 day moving average has served as strong support for the market. As can be seen in the below chart, the S&P 500 Index closed below the 50 day moving average on Friday. What appears important about the technical set up at this point is the stochastic indicator is just now showing an overbought level for the market. In prior 50 day moving average violations, the stochastic indicator did not show as oversold until the market found support at the 150 day moving average.

From The Blog of HORAN Capital Advisors


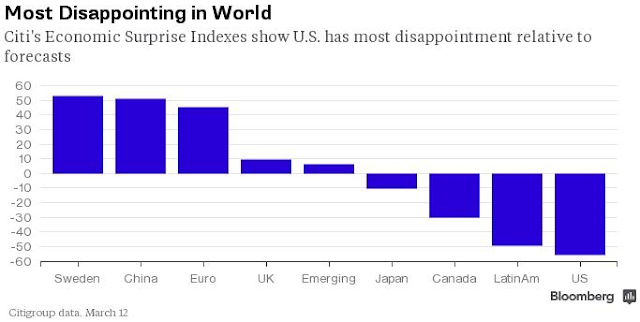
Economic Surprise Indices: Bad News Might Actually Be Good News

One criteria investors and strategists evaluate on a regular basis is whether or not economic data that is reported on a near daily basis is exceeding or missing expectations. A commonly reviewed index is the Citigroup Economic Surprise Indices (CESI). According to Bloomberg,
"The Citigroup Economic Surprise Indices are objective and quantitative measures of economic news. They are defined as weighted historical standard deviations of data surprises (actual releases vs Bloomberg survey median). A positive reading of the Economic Surprise Index suggests that economic releases have on balance [been] beating consensus. The indices are calculated daily in a rolling three-month window. The weights of economic indicators are derived from relative high-frequency spot FX impacts of 1 standard deviation data surprises. The indices also employ a time decay function to replicate the limited memory of markets."

One takeaway from the negative level of the CESI for the U.S. is the fact economic reports have been falling short of strategist expectations. This in turn could push the Fed to act later on pushing short term interest rates higher. Also, as noted in a recent article in the Wall Street Journal, When Bad News Is Good for Stocks,
"It is important to understand, though, that the surprise index doesn’t rise or fall with the ebb and flow of the economic cycle. Because it measures a rolling average of how things turn out relative to forecasts, more often than not it tends to turn negative after there has been a streak of encouraging economic news, such as in late 2014. This is because forecasters often mistakenly extrapolate recent trends."
"When the index is deeply negative, as it is today, that is usually a good sign for stocks. Following the weakest 5% of observations since 2003, the S&P 500 rose by 14.4%, on average, during the following six months. Conversely, it rose by just 5.5% following times when the surprise index was highest."

"Today’s trough puts the index in the lowest 8% of readings. This is unusual given stocks are within spitting distance of all-time highs, despite softer-than-expected economic reports."

"The possible reason for this revolves around the Federal Reserve, which may be just months away from raising interest rates for the first time in nine years. News that is disappointing enough to sow doubt in rate setters’ minds without signaling a recession is seen as ideal for stock prices."

From The Blog of HORAN Capital Advisors

Further, the CESI for the Euro Zone has been counter to that of the U.S., that is, economic data reports have been exceeding strategists' expectations and the Euro STOXX 600 Index has responded positively. We have commented frequently with clients about the recent need to hedge the exposure to the the Euro versus the US. Dollar in order to protect returns generated in the Euro currency.

From The Blog of HORAN Capital Advisors

For investors, is this string of expectation beating reports in Europe nearing an end? We do not believe so. We are seeing corporate earnings report revisions trending more to the positive than the negative as well as continued expectation beating economic reports out of Europe. We touch on several of these points in our soon to be released Investor Letter. In a recent Bloomberg article,
"Jack Ablin, chief investment officer of BMO Private Bank in Chicago, said he pays attention to the surprise indexes as a way to gauge when a particular national economy may be turning and looks for good value in equities.
From The Blog of HORAN Capital Advisors
It is an early indication of a momentum shift," he said, "adding that he's been raising the amount of money put into international stocks. While Ablin expects moderate U.S. growth, he said a strong U.S. dollar has the potential to dampen the expansion."

Interestingly, the Economic Surprise Indices readings could be suggestive of a market environment that is broadly favorable for a number of global equity markets. The desire by the U.S. Fed to get rates off the near zero level and data that pushes this further into the future and conversely, a number of central banks outside the U.S. pursuing quantitative easing measures, both can be positive for global equity markets.


Sunday, April 12, 2015

Expecting A Weak Q1 2015 Earnings Season, But Looking At Forward Guidance

With first quarter 2015 earnings season beginning to hit full stride in the coming two weeks, earnings growth expectations for Q1 2015 are now negative at -4.6%. The last negative quarterly growth result was Q3 2012 as can be seen in the below table from Factset.

From The Blog of HORAN Capital Advisors
Source: Factset

Out of the small percentage of S&P 500 companies that have reported to date, 70% have cited the strong Dollar as the cause of their negative Q1 2015 report. As noted at the beginning of the article, the last negative earnings growth quarter occurred in Q3 2012. Importantly, these earnings reports are reflective of past results and investors will want to pay attention to forward guidance. Subsequent to the Q3 2012 negative growth quarter, the S&P 500 Index went on to generate outsized gains of 30% in 2013 as can be seen in the below table.

From The Blog of HORAN Capital Advisors

To provide some insight on the US Dollar strength and noted in the Factset report,
  • "During the course of the first quarter, the dollar strengthened relative to the euro. On December 31, one euro was equal to $1.21 dollars. On March 31, one euro was worth about $1.07 dollars."
  • "The dollar has also strengthened relative to year-ago values for both the euro and the yen. In the year ago quarter (Q1 2014), one euro was equal to $1.37 dollars on average. For Q1 2015, one euro was equal to $1.13 dollars on average. In the year-ago quarter (Q1 2014), one dollar was equal to $102.76 yen on average. For Q1 2015, one dollar has been equal to $119.17 yen on average."
Lastly, it should be noted the earnings and revenue expectations from the energy sector are a significant contributor to the Indexes overall decline in earnings and revenue growth. We believe, though, the lower energy prices are a net plus to the economy via the benefit the consumer receives from lower energy prices.

The first quarter reports almost seem like a replay from the first quarter of 2014 when weather across the country was a significant drag on economic growth. In Q1 2015 we had weather effects as well. On top of the weather, the West Coast Port shutdown also negatively impacted the retail segment. For investors, hearing forward guidance comments from the conference calls this quarter will be important in ascertaining future earnings expectations.


Friday, April 10, 2015

Emerging Markets Not Out Of The Woods Yet

As investors seem to be expecting an increase in interest rates by the Fed to be pushed out later this year, the emerging market trade has seen a positive impact relative to its U.S. developed counterpart. As the below chart shows, on a year to date basis the iShares MSCI Emerging Markets ETF (EEM) has moved up 9% versus the S&P 500 Index return of 2%.

From The Blog of HORAN Capital Advisors

This risk on appetite has carried over into small cap stocks as well. Year to date the Russell 2000 Index is up 5% versus the previously noted 2% for the S&P 500 Index.

From The Blog of HORAN Capital Advisors


These are a couple of divergences we mentioned in a post at the beginning of 2015 that the market would need to address, A Market Needing To Resolve Divergences In 2015.

Lastly, on a longer term basis, Dollar strength has historically been a headwind for emerging market investors. Maybe the rate increase cycle begins later this year; however, when it does, downward pressure could face emerging market investments as the rate increase nears.

From The Blog of HORAN Capital Advisors


Thursday, April 09, 2015

A Good Quarter To Be a Non-Dividend Paying Stock

Through the first quarter of 2015, performance would suggust it was a good time to be a non dividend payer stock. As the below table shows, the average return of the non-payers generated a return of 6.49% versus the payers average return of 1.16%. I would note, however, the average return in the quarter for both the payers and non-payers exceeded the cap weighted return of the overall S&P 500 Index.

From The Blog of HORAN Capital Advisors