Sunday, July 08, 2012

Issues To Impact The Market In Second Half Of 2012

Investors and consumers will face a number of key issues in the second half of 2012 that are likely to impact their confidence level due to the influence these issues will have on the markets. One impact is potentially higher equity market volatility and this will not be a positive to investor confidence. Some of the issues and the respective dates investors need to keep an eye on are:
  • September 2012: Debt Ceiling Debate: The market's response to the debt ceiling debate last year: it started a six week decline following S&P's downgrade of the credit rating for the U.S. President Obama has stated to Congress July 22 is the deadline for coming to an agreement to increase the debt ceiling by $2 trillion. The news flow resulting from this issue will likely have an impact on the market and influence investor confidence. The debt ceiling is expected to be reached in early September.
From The Blog of HORAN Capital Advisors

  • November 2012, U.S. Elections: The political rhetoric will undoubtedly be raised to a heightened level as the November elections approach. Historically, the equity market is stronger in the second half of a presidential election year. Given the many issues that will need to be addressed in the balance of the year, it remains to be seen whether the market can move higher in the face of these hurdles. Also, the lame duck session of Congress could lead to market moving headlines.
From The Blog of HORAN Capital Advisors

  • December 2012, Fiscal Cliff: The fiscal cliff is in reference to the expiration of the so-called Bush tax cuts, expiration of the payroll tax cut, the implementation of automatic spending cuts and the initiation of additional taxes to support the new healthcare law, all beginning in 2013. This fiscal cliff is as much as 3.9% of GDP and is likely to have a negative impact on economic growth in the U.S. The below table outlines various scenarios that could play out through 2015 and the resulting impact on GDP.
From The Blog of HORAN Capital Advisors

  • December 2012, The End of Operation Twist: The Fed recently stated they will maintain Operation Twist through the end of this year. Although this liquidity program really artificially impacts the market, past Federal Reserve actions have tended to support higher equity market returns. Interestingly, each subsequent liquidity action by the Fed is having a smaller positive impact on equity market returns. The culmination of this program at the end of the year, along with the consequences of the fiscal cliff, will certainly weigh on investor sentiment. The end of prior Quantitative Easing (QE) programs have been met with a weakening equity market.
From The Blog of HORAN Capital Advisors

Source: Schwab
  • Ongoing, Euro Zone Issues: The one issue that will not end any time soon is that of the EU. This European Debt Crisis link not only outlines the current actions taken by the European Union, but also is evidence of the many steps yet to be taken in an attempt to resolve the crisis in the EU. It is almost certain that every news headline on EU efforts to deal with their debt crisis will be market moving. Some will move the market higher and some will result in the equity market moving lower. The point is the EU issues will inject volatility into global markets.
Very near term, companies will begin reporting second quarter earnings. The bar is set pretty low for earnings with earnings estimated to increase only 3% in Q2. Since the beginning of Q2, earnings growth expectations have been reduced from 6.8%. According to Factset Research, analysts have reduced estimates for the third and fourth quarters as well. As of July 6th, the projected growth rate for Q3 2012 has fallen from 6.0% to 2.0%, while the projected growth rate for Q4 2012 has fallen from 16.1% to 13.9%.

The above are just some of the macro issues that will face investors in the balance of the year. The Conference Boards Consumer Confidence Index reported at the end of June showed a fourth straight monthly decline in confidence. The Board notes if this trend continues it is most likely to begin to negatively impact consumer spending.Maybe consumers and investors are taking note of these potential issues already.


Saturday, July 07, 2012

Economic Decoupling Intrigue

With the hurdles facing many of the countries in the Euro zone, strategist have been tossing around the idea that the U.S. economy may in fact be decoupling from the rest of the economies around the globe. This is certainly an intriguing thought and would be supportive of better equity returns in the U.S. Better equity return doesn't necessarily mean positive returns though.

One recently cited data point is the strength of the U.S. PMI (Purchasing Managers Index) relative to other country PMIs. The PMI measures the health of the manufacturing sector of the economy. Readings greater than 50 indicate the manufacturing sector is expanding while readings under 50 indicate a contracting manufacturing sector. As displayed in the below chart, the U.S. has been a standout versus a number of the other countries and regions.

From The Blog of HORAN Capital Advisors

The above chart is showing data through May and the recently reported June U.S. PMI came in at 49.7. This was the first below 50 reading for the U.S. PMI since July 2009. With the June report, it appears decoupling may in fact not be occurring since the manufacturing segments of many economies are now contracting. It is not surprising the U.S. PMI is now below 50 given the interconnectedness of the world economies and the large percentage of revenue generated outside the U.S. by U.S. companies.

From an equity market return perspective, the equity returns in the U.S. still appear to be positively correlated with equity returns outside the U.S., as well, specifically, Europe and the emerging markets. In the two charts below there remains a positive correlation between the S&P 500 Index and both the STOXX 600 Index (Europe) and the MSCI Emerging Markets Index. Positive correlation numbers indicate the two indices move in the same direction. For the emerging market index and the S&P, the recent correlation coefficent equals .62. This means 38% (.62 squared) of the variation in return is related.

From The Blog of HORAN Capital Advisors

From The Blog of HORAN Capital Advisors

In the end, I do not believe we will see a complete decoupling of the U.S. markets and economy with the other markets and economies around the world. I do believe the U.S. is in slightly better shape than many of the Euro zone economies as well as some emerging markets. Therefore, on a relative basis, the U.S. could continue to outperform a number of its foreign counterparts, with one example being the recent performance of the S&P 500 Index relative to the performance of the emerging markets index detailed below.

From The Blog of HORAN Capital Advisors

After the emerging markets outperformance from 2000 through 2010, maybe the S&P is poised for stronger relative returns in the coming decade for a whole host of reasons. Market returns do not move higher in a straight line and market volatility is likely a continuing theme. Additionally, there are near term potential headwinds: an upcoming debt ceiling debate, the fiscal cliff, the U.S elections in November, just to name a few. For a more detailed review of factors to consider, Charles Schwab's Chief Investment Strategist, Liz Ann Sonders' recently released the July Market Snapshot video and it is a worthwhile video to view.


Wednesday, July 04, 2012

Dividend Payments and Buybacks Decline In First Quarter

Both aggregate dividend payments and buybacks for companies in the S&P 500 Index declined in the first quarter of 2012. The decline in dividend payments is not unusual as first quarter payment amounts have been lower in Q1 versus the prior Q4 in ten out of the eleven first quarter periods since 2001. The pattern for buybacks is more mixed as aggregate buybacks have declined in six of the eleven first quarter reports since 2001. On a year over year basis, dividends are up 14.2% while buybacks actually declined 6.2%. S&P notes this decline in YOY buybacks is the first decline since the fourth quarter of 2009.
From The Blog of HORAN Capital Advisors

In a report from S&P on Tuesday, they note net dividend payments in the second quarter where higher by $12 billion, which S&P believes is a record dividend payout in aggregate dollars terms for U.S. domestic equities. Howard Silverblatt, Senior Index Analyst at S&P notes,
"Payout rates, which historically average 52%, remained near their lows at 31%. At this point, we expect to see double-digit growth in actual dividend payments for the remainder of 2012, which would equate to a 16% gain over 2011."
Complicating dividend payment trends beyond this year is the impact expiring tax legislation will have on dividends at the end of 2012 that could increase the tax rate on dividends to over 43% versus the current 15% rate.


Will Individual Investors Continue To Get The Market Direction Right?

One thing investors experienced and seemed to have learned was their mistake of piling into the stock market at the top of the technology bubble in 2000. As the below graph indicates, investors allocated significant dollars to equities, based on monthly mutual fund flows, just prior to the technology bubble bursting in early 2000. However, since that time, investors seem to be timing their market moves correctly. At the bottom of the tech bubble in 2002, investors began investing funds into equity mutual funds fairly steadily up until 2008. At the top of the market in 2008, just prior to the financial crisis that impacted the market in 2008-2009, investors began pulling funds from equities and subsequently reinvesting in stocks at the end of the recession.

From The Blog of HORAN Capital Advisors

However, since mid-2010 the S&P 500 Index is up nearly 35% and investor flows into equity mutual funds have actually been negative. They seem to sense a better opportunity in bonds. Not that bonds haven't delivered reasonable returns, but bond returns have trailed returns for the broader equity market over the most recent 2-year time period.

From The Blog of HORAN Capital Advisors

As the above two charts indicate, investors have not warmed up to equities over the last two years. There are many reasons why, volatility, euro zone issues, issues in Washington, DC, etc., but, will they be proven correct this time? The equity markets do seem to be climbing that proverbial wall of worry and maybe pessimism about the markets is overdone to the downside vis-à-vis fundamentals.


Tuesday, June 26, 2012

The Consequences of U.S. Government Expenditures Outpacing Revenue

One fact of little debate is the U.S. continues to spend at a rate far outpacing the amount of revenue it receives. The consequence of this level of spending is the U.S. government continues to take on a greater amount of debt each year. Further complicating this mismatch between revenue and expenditures is the level of "mandatory" expenditures is growing at a 7% rate according to the OMB. A recent report by Charles Schwab and Argus Research notes:
  • Government outlays soared from 20.1% of GDP in the last Bush term to 24.4% in 2009-12. Meanwhile, government receipts fell from 17.9% of GDP in the last Bush years to 15.3% in the Obama years.
  • Over half the drop in receipts has been due to lower payroll taxes.
  • After 2013, the Office of Management and Budget projects interest on publicly held debt will jump
    from 8.8% to 14.5% of total receipts.
  • OMB also projects that “mandatory” federal spending will rise at a 7% annual rate, from 2011 to 2017— as fast as it did in the past six years.
  • The deficit is expected to decline to 3% of GDP over time, but that is based on the assumption that individual and corporate income taxes rise by rates of 10% and 17%, respectively.
From The Blog of HORAN Capital Advisors


Wednesday, June 20, 2012

Investor Equity Fatigue

It is understandable that investors have developed fatigue when it comes to investing in stocks. As the below chart shows, since 2000, investors have essentially made no money in stocks. Compounding this is the fact that the return necessary to recover from the equity market declines is more than double the losses that have been incurred.

From The Blog of HORAN Capital Advisors

One outcome of the equity market volatility is investors have continued to allocate more of their investment dollars to fixed income/bond investments. Given the low level of interest rates though, a spike higher in rates can have a detrimental impact on ones bond portfolio. Many investors experienced this outcome in the first quarter this year.

From The Blog of HORAN Capital Advisors

At HORAN, we believe investors can still make money in stocks; however, a buy and hold strategy will not provide the best return outcome in this environment. Being more tactical and taking a little money off the table (taking some gains) when stocks run up is a necessity during these times.


Sunday, June 17, 2012

Where To Invest In The Coming Years

Richard Bernstein of Richard Bernstein Advisors and Bill Wilby, former manager of the Oppenheimer Global Fund discuss why the U.S. is the best place to invest in the coming years. For equity investments Bernstein's favorite asset class is small capitalization companies while Wilby is focusing on high quality large capitalization dividend payers.

Source: WealthTrack


The New Normal: Continued Volatility

A recent investment newsletter from PIMCO's Neel Kashkari, takes a look back at PIMCO's application of the "New Normal" comment for the global economy in the spring of 2009. "The New Normal called for long-term deleveraging that would lead to lower growth than society had been accustomed to." One outcome of this New Normal cycle has been an increase in market volatility.

A result of this heightened volatility is the fact investors have become skeptical of the equity markets. PIMCO notes:
  • "From May 2002 to May 2007, during the old normal, the S&P 500 experienced a 5% correction from a recent high five times, or on average of once per year, and a 10% correction four times."
  • "In the three New Normal years from May 2009 to May 2012, the S&P 500 experienced seven 5% corrections, more than twice as often, and a 10% correction three times."
This increased downside volatility is evidence investors should consider investment strategies that could limit the negative impact of downside market returns. Aside from sitting in cash, some of the strategies mentioned in the article include:
  • "Buying higher-quality companies and those with strong balance sheets, because they tend to be more resilient against shocks, according to our research."
  • "Buying companies at deep discounts to their intrinsic value."
  • "Buying companies offering more immediate return on investment through dividends."
  • "Actively hedging the portfolio, with tail risk hedging (which refers to taking a defensive position against extreme market shocks), or other means."
  • "Investing in multi-asset solutions that provide diversification and include equities, fixed income securities and commodities in one vehicle."
Lastly, investors and investment advisers have a choice between active and passive investment management. A potentially significant drawback of passive investment in the New Normal environment, i.e., more frequent market declines,  is investor returns will decline with the market. The S&P 500's near 40% decline in 2008 is evidence of this type of market action. For investors taking distributions from their accounts, returns like those incurred in 2008 can be more detrimental.

For investors that incorporate some downside protection in their investment strategy, this does not come without a price. Downside protection is likely to limit some of the returns achieved in an up market. However, outperforming in a down market can still result in outperformance and higher compound returns over a complete market cycle.

Source:

Three Years and Counting
By: Neel Kashkari
PIMCO
June 2012
http://www.pimco.com/EN/Insights/Pages/Three-Years-and-Counting.aspx


Thursday, May 31, 2012

Individual Investor Bullish Sentiment Remains Low

In today's sentiment survey released by the American Association of Individual Investors, bullish investor sentiment declined to 28.02% versus last week's reading of 30.47%. The bull/bear spread was also more negative at -14% versus -8% in the prior week. Additionally, the 8-period moving average of bullish sentiment is at its lowest level, 28.7%, since March of 2009 when this average was reported at 27.5%.

From The Blog of HORAN Capital Advisors

The AAII sentiment survey is a contrarian indicator and this low bullishness level is only one indicator that might suggest the market is at a low point; however, Barry Ritholtz of The Big Picture website points to an analysis by Jim Bianco at Bianco Research noting the confused sentiment of the market based on newsletter writers. Certainly, a number of issues like the euro zone crisis seem to be driving sentiment at the moment, along with recently reported weaker economic data in the U.S.


Monday, May 28, 2012

Jason Trennert: The Bill Has Come Due


Jason Trennert is interviewed by Consuelo Mack on this week's WealthTrack. Jason discusses where investors should consider allocating their investments given the uncertainty surrounding the upcoming elections and the so called $537 billion "fiscal cliff" looming large at the end of the year.

The fiscal cliff is in reference to the expiration of the so-called Bush tax cuts, expiration of the payroll tax cut, the implementation of automatic spending cuts and the initiation of additional taxes to support the new healthcare law all beginning in 2013. This fiscal cliff is 3.5% of GDP and would likely have a negative impact on economic growth in the U.S. Additionally, Jason believes high quality dividend paying stocks are like "new sovereigns" given the low level of interest rates on U.S. government debt.


Sunday, May 20, 2012

Equity Put/Call Ratio Approaching 1.0

In the third week of August last year we noted the equity put/call ratio had climbed above 1.0 as noted in the post, Equity Put/Call Above 1.0 Again. As we wrote in that post,
"The equity P/C ratio tends to measure the sentiment of the individual investor by dividing put volume by call volume. At the extremes, this particular measure is a contrarian one; hence, P/C ratios above 1.0 signal overly bearish sentiment from the individual investor. This indicator's average over the last 5-years is approximately .7, indicating the individual investor has been generally mostly bullish and more active on the call volume side"
The S&P 500 Index closed at 1,123 on 8/19/2011 and traded sideways to down before reaching a low of 1,099 on 10/3. So from August 19 to October 3 of last year, the S&P fell an additional 2.1% after the equity put/call ratio rose above 1.0.

Well, here we are today with the P/C ratio approaching 1.0 again and bearish sentiment at elevated levels.

From The Blog of HORAN Capital Advisors

The news that triggered the decline last year is not too different from the news impacting the market currently. Following is what we wrote in August last year.
"At HORAN, we believe business fundamentals are contrasting with equity market actions. This divergence is being driven in large part by the lack of confidence in Europe in dealing with its sovereign debt issues and in Washington's inability to deal with its budget deficit. Additionally, the amount of regulatory uncertainty that includes health care reform and potential income tax reform is a factor in business' ability to commit to longer term expansion plans."
Liz Ann Sonders, Chief Investment Strategist at Charles Schwab, notes,
But there is a long list of positive offsets this year relative to the past two years:
  • Inflation is coming down, especially among commodity prices.
  • Credit growth is quite strong, especially for consumers.
  • Housing has improved markedly.
  • The US manufacturing sector is humming.
  • NFIB's small business survey made recent upside breakout.
  • Job growth is much better.
  • Consumer confidence is improving.
  • Private-sector leverage ratios are much improved (debt servicing costs are extremely low).
  • Recovery in state/local government spending.
  • The US economy somewhat decoupling from rest of world; at least Europe.
  • US bank capital/health is much better than Europe's.
  • The European Central Bank's Long-Term Refinancing Operations have reduced likelihood of global financial contagion.
  • Germany appears more willing to accept higher inflation, opening the door to easier monetary policy for the eurozone.
  • Valuations are quite cheap, especially on forward earnings.
  • Investor sentiment has improved sharply with the correction to-date (meaning pessimism has kicked back in).
It is difficult to predict a market bottom and certainly the S&P 500 index could trade lower in the very near term; however, business fundamentals look positive and sentiment is approaching levels indicating pessimism may be overdone. 


Thursday, May 10, 2012

Significant Drop In Investor Bullish Sentiment

The American Association of Individual Investors reported a significant drop in bullish investor sentiment this morning. The bullish sentiment fell ten percentage points to 25.40% versus 35.40% last week. This week's reading is the lowest level for bullish sentiment since September 22nd last year when bullish sentiment was reported at 25.33%. The bull/bear spread is now -16.66% versus last week's spread of 6.93%.

From The Blog of HORAN Capital Advisors


Wednesday, May 09, 2012

Earned Success Or Learned Helplessness: Choosing A College Degree

This post is a little bit off the path of a direct investment market or economic topic that I generally write. However, the observations do have implications for the employment market and how future college graduates might improve their employment prospects.

We are entering that time of year where students are celebrating their graduation from high school and college. Having recently attended Indiana University's graduation and talking with some of the graduates, it was evident that not all seniors were successful in securing a job. Prior to the IU graduation, I attended the academic signing day at the high school in our community. The academic signing is where the top graduating seniors, i.e., those achieving a 4.0 or higher grade point average during their 4-years of high school, announce their college choice and intended major. The common thread for both functions I attended is the selection of ones major is an important decision and can significantly impact one's marketability upon graduating from college.

For the high school seniors going on to college, the end of their college days are a long way off, at least 4-years, and a lot can change economically that affects the job market. However, I was surprised at some of the intended majors announced by some of these top high school seniors. Several of the majors announced by the graduating seniors fell into an area of study that currently has one of the highest rates of unemployment.

Several recent articles in the Wall Street Journal touch on some of the issues facing college graduates. It may seem obvious, but one important factor is the major pursued by college graduates. In many emerging economies, students in those markets select majors in either a hard science or engineering. Degrees in these fields provide one with an education that qualifies them for a number of job disciplines, even jobs that are not directly tied to the area of study. The WSJ article, "To the Class of 2012," notes a number of today's graduates lack factual knowledge due to the education community's focus on teaching "thinking" skills at the expense of having students learn facts. As noted in the article,
"Many of you [college graduates] have been reared on the cliché that the purpose of education isn't to stuff your head with facts but to teach you how to think. Wrong. I routinely interview college students, mostly from top schools, and I notice that their brains are like old maps, with lots of blank spaces for the uncharted terrain. It's not that they lack for motivation or IQ. It's that they can't connect the dots when they don't know where the dots are in the first place."
The article went on to note,
"In every generation there's a strong tendency for everyone to think like everyone else. But your generation has an especially bad case, because your mass conformism is masked by the appearance of mass nonconformism. It's a point I learned from my West Point intern, when I asked her what it was like to lead such a uniformed existence.

Her answer stayed with me: Wearing a uniform, she said, helped her figure out what it was that really distinguished her as an individual."
The other Wall Street Journal article, America and the Value of 'Earned Success', highlighted the author's path after he left Spain a number of years ago. In Spain this was unheard of since many job functions were guaranteed for life. If the job did not pan out, they found ways to qualify for lifetime disability paying the same salary as their job. When the author and his wife arrived in the U.S., they both ultimately landed jobs. The individual notes, "In the end, I concluded, what set the United States apart from Spain was the difference between earned success and learned helplessness (emphasis added)." The author goes on to note,
"The link between earned success and life satisfaction is well established by researchers. The University of Chicago's General Social Survey, for example, reveals that people who say they feel "very successful" or 'completely successful' in their work lives are twice as likely to say they are very happy than people who feel 'somewhat successful.' It doesn't matter if they earn more or less income; the differences persist.

The opposite of earned success is 'learned helplessness,' a term coined by Martin Seligman, the eminent psychologist at the University of Pennsylvania. It refers to what happens if rewards and punishments are not tied to merit: People simply give up and stop trying to succeed.

Learned helplessness was what my wife and I observed then, and still do today, in social-democratic Spain. The recession, rigid labor markets, and excessive welfare spending have pushed unemployment to 24.4%, with youth joblessness over 50%. Nearly half of adults under 35 live with their parents. Unable to earn their success, Spaniards fight to keep unearned government benefits.

Meanwhile, their collective happiness—already relatively low—has withered. According to the nonprofit World Values Survey, 20% of Spaniards said they were "very happy" about their lives in 1981. This fell to 14% by 2007, even before the economic downturn.

That trajectory should be a cautionary tale to Americans who are watching the U.S. government careen toward a system that is every bit as socially democratic as Spain's.

Government spending as a percentage of GDP in America is about 36%—roughly the same as in Spain. The Congressional Budget Office tells us it will reach 50% by 2038. The Tax Foundation reports that almost 70% of Americans take more out of the tax system than they pay into it. Meanwhile, politicians foment social division on the basis of income inequality, instead of attempting to improve mobility and opportunity through education reform, pro-growth policies, and an entrepreneur-friendly economy.

These trends do not mean we are doomed to repeat Spain's unhappy fate. But our system of earned success will not defend itself." 
For the graduating high school seniors and college seniors continuing their education, certainly pursue a field of study that you are passionate about, while at the same time making the education pursuit a rigorous one. Don't simply focus on classes that inflate your GPA if the course truly does not increase your factual knowledge. A rigorous course of study could mean the difference between "earned success" and "learned helplessness."


Monday, May 07, 2012

Dividend Payers Outperform In April

Standard & Poor's April performance update for the dividend payers versus non-payers in the S&P 500 Index shows the payers outperformed in April. The outperformance was almost 200 basis points or two percentage points, 1.72% versus -.12%, respectively. In spite of the strong April performance for the payers, the payers trail the non-payers on a year to date basis, 13.35% versus 16.40%, respectively. For the twelve month period, the payers have outperformed by more than 700 basis points though.

From The Blog of HORAN Capital Advisors

Data source: S&P


Saturday, April 28, 2012

Why Economic Growth Has Been So Low

As many of our clients and prospective clients know, we frequently discuss the strength of the corporate sector of the economy. As the below chart shows, corporate profit growth has continued to strengthen.

From The Blog of HORAN Capital Advisors

With this level of corporate profit strength, one has to ask why economic growth (GDP) has not been stronger. The first report on first quarter GDP Friday indicated growth was running at 2.2% versus expectations of 2.5%. A recent post at the blog, Calafia Beach Pundit and written by Scott Grannis, the former Chief Economist at Western Asset Management, notes the drag the government sector is having on economic growth:
"Here's another way of appreciating what has happened in recent years. The private sector has been working very hard to increase its efficiency and its output, and that shows up in the record level of corporate profits, both in nominal terms and relative to GDP. But instead of allowing or encouraging the private sector to plow those profits back into the economy in the form of new plant and equipment, new jobs, and new technologies, the federal government has effectively borrowed all the corporate profits generated since 2009 and distributed the money to the unemployed, to the poor, to favored "green" industries, to unions, to state and local governments, and to "make-work projects," among other things. There's been a lot of money thrown around, but lots of it has been wasted in the process that could have been put to better use; we simply don't have much to show for the $1.25 trillion of after-tax profits generated per year on average by U.S. businesses since 2009. (I'm referring here to the fact that federal deficits in recent years have been roughly equivalent to after-tax corporate profits—actually a bit higher. So on a "sources and uses of funds" basis, the government has effectively used all corporate profits to fund its spending.)"
GDP is commonly defined as:

GDP = C + I + G + (X - M)

Where,
  • C = private consumption
  • I = gross investment
  • G = government spending
  • (X - M) = exports - imports
Government expenditures on final goods and services includes salaries of public employees, purchases of military equipment and any investment expenditure by the government. It does not include transfer payments, such as social security or unemployment benefits.

As Scott Grannis notes in his article, there are many aspects of government expenditures that have not been additive to U.S. economic growth in spite of the strength in the corporate sector of the economy.


Better Investing's Most Active Stocks For The Period Ending April 28, 2012

Better Investing Magazine publishes the most active stocks reported by its membership. The list is based on an informal sampling of Better Investing members. Below is the list of the most active stocks for the period ending April 28, 2012

Full View


Thursday, April 26, 2012

Low Investor Bullish Sentiment Positive For Stock Returns?

Today's investor sentiment release by the American Association of Individual Investors shows investor bullish sentiment is at the lowest level since September 22, 2011. The bullish sentiment reading was reported at 27.64% or a 3.5% decline from the prior week. This is the lowest reading since the bullish sentiment reading on 9/22/2011 when bullish sentiment was reported at 25.33%. The bull/bear spread is at -9.8% while it was reported at -22.7 on September 22nd of last year. The investor sentiment reading records investor expectations for the equity markets in the upcoming six months and is considered a contrarian indicator.

From The Blog of HORAN Capital Advisors
Data Source: American Association of Individual Investors.


Wednesday, April 25, 2012

First Quarter 2012 Investor Letter

The first quarter of 2012 ended a period where the equity markets generated two consecutive quarters of strong market returns. Most investors would find the returns generated in the first quarter acceptable for returns in an entire year. The S&P 500 Index was up 12.5%, the MSCI Developed Equities Index was up 11.7% and the MSCI Emerging Markets Index was higher by 14.1%. Recent earnings reports for Q1 continue to exceed analyst expectations. Our newsletter covers Q1 events as well as recent events impacting the the investment markets.

The Letter can be accessed directly from our website at the following link: 1st Quarter 2012 Investor Letter

We hope you find the content of our letter insightful as 2012 continues to unfold.


Sunday, April 22, 2012

Apple's Stock Trading Far Above Its Trend Line

Apple (AAPL) stock continues to dominate headlines from day to day. Of particular importance will be the company's earnings report on Tuesday after the market's close. Over the last nine trading days, the price of Apple's stock has declined from an all time high of $644/share to close on Friday at $572/share, just above its 50 day moving average of $569/share.

From The Blog of HORAN Capital Advisors

The below chart shows AAPL's stock price relative to its longer term trend line. The trend line support is around $449/share which is near its 200-day moving average price of $438/share. Interestingly, the year to date advance in the company's stock price has occurred during a period of declining trading volume for the stock. For investors, does this gap above its longer term trend warrant caution?

From The Blog of HORAN Capital Advisors


Saturday, April 21, 2012

Game Theory Strategy Displayed

An interesting display of game theory in the below video.


Saturday, April 14, 2012

Procter & Gamble Increases Dividend 7% And Payout Ratio Continues To Increase

On Friday, Procter & Gamble (PG) announced a 7.05% increase in the company's quarterly dividend. The dividend increases to 56.2 cents per quarter versus 52.5 cents in the same quarter last year. The 7% increase is one of the lowest rate of increases in recent years. The payout ratio increases to 56.8% based on fiscal year 2012 estimated earnings of $3.96. Earnings for FY 2013 are estimated at $4.30 or growth of a little over 8%.

From The Blog of HORAN Capital Advisors

On a one year basis the stock return of P&G has essentially matched the return of the S&P 500 Index; however, on a year to date basis, P&G's return has lagged the market by almost 10 percentage points. P&G's stock does tend to hold up well during market corrections as noted by the performance of the stock late last year. On a technical note, the trading volume has spiked over the last few trading days on down days for the stock.

From The Blog of HORAN Capital Advisors

Disclosure: Our firm is long PG


Tuesday, April 10, 2012

Dividend Payers Experience Multiple Expansion At Low Nominal Interest Rates

A recent report from Fidelity Investments shows that multiples expand for dividend paying stocks with high payout ratios when nominal interest rates are at extremely low levels as rates are today.

From The Blog of HORAN Capital Advisors

From The Blog of HORAN Capital Advisors

Essentially, the report indicates investors view high dividend payout equities as bond substitutes. The report states:
In a market with extraordinarily low nominal yields, the relationship supporting the
risk premium between equity and fixed income is challenged, and stable high quality dividends can be viewed similarly to a bond coupon. Thus it would be logical for the market to value dividends within the prevailing yield structure of the fixed income market:

Price/Dividend = f (Interest Rates)
Undistributed earnings are still subject to economic uncertainties with investors expressing concern about a company's ability to effectively allocate capital. Consequently, we see a higher equity risk premium in the non dividend payers at low nominal rates.

From The Blog of HORAN Capital Advisors

From The Blog of HORAN Capital Advisors

The Fidelity report details the performance of of dividend payers in the Nikkei Index during the 2002-2012 time period. For Japan this period has been characterized by persistent deflationary pressures and the higher dividend payers have outperformed with lower volatility.

Investors need to keep in mind these higher yielding stocks are still equities. As such, equities are subject to the vagaries of the movements in the stock market.

Source:

What if the Market is Revaluing Dividends? (PDF)
Fidelity Asset Management
By: James Morrow, CFA and Neil Nabar, CFA
March 2012
http://fiiscontent.fidelity.com/939518.PDF?pos=R


Sunday, April 08, 2012

Low Expectations For Earnings In Q1 2012

A low bar has been set for year over year earnings exceptions for the first quarter. According to ThomsonReuters, "the earnings growth rate for the S&P 500 for Q1 2012 is 3.2%. Excluding Apple (AAPL), the overall growth rate declines to 1.8%. The Industrials (10.6%) and Consumer Discretionary (6.6%) sectors have the highest growth rates for the quarter, while Materials (-14.7%) has the weakest growth rate." Factset has a slightly lower earnings outlook for Q1 noting, "the estimated earnings growth rate for Q1 2012 is -0.1%. Seven of the ten sectors are predicted to see a decline in earnings in Q1 2012, led by the Materials (-14.5%) and Telecom Services (-10.1%) sectors."

From The Blog of HORAN Capital Advisors


Friday, March 30, 2012

Buybacks Decline Along With Earnings In Q4 2011

Standard & Poor's fourth quarter 2011 preliminary buyback report for the S&P 500 Index shows buybacks declined in Q4 along with reported earnings. Preliminary earnings were reported at $186.76 in Q4 2011 versus $206.08 in Q3 2011 and $187.67 billion in Q4 2010, while buybacks declined to $91.46 billion versus $118.41 billion in the prior quarter.

From The Blog of HORAN Capital Advisors

S&P's Howard Silverblatt, Senior Index Analyst, notes,
“Companies appear to have finally gotten it right with average share prices declining 14.3% during the third quarter of 2011, companies poured $118 billion into stock buybacks (the most since the heydays of 2007), buying back shares at reduced prices. With depressed prices, companies were able to scoop up additional shares, which reduced the number needed for year-end employee options. In the fourth quarter, with share prices increasing an average of 11.2%, they pulled back.”
I would agree with S&P that it is better for companies to buyback shares at the lower prices reached in Q3 last year. However, this buyback volume can distort reported earnings per share and mask weakness in earnings growth. With fewer shares, earnings growth on a per share basis will be higher than actual corporate earnings growth. Bloomberg reports, the buyback activity reduced Standard & Poor’s 500 Index divisor, a measure of outstanding shares, by 0.6 percent last quarter, the first drop since March 2009.

From The Blog of HORAN Capital Advisors


Sunday, March 25, 2012

The Number Of Dividend Payers In S&P 500 Index At 12-Year High

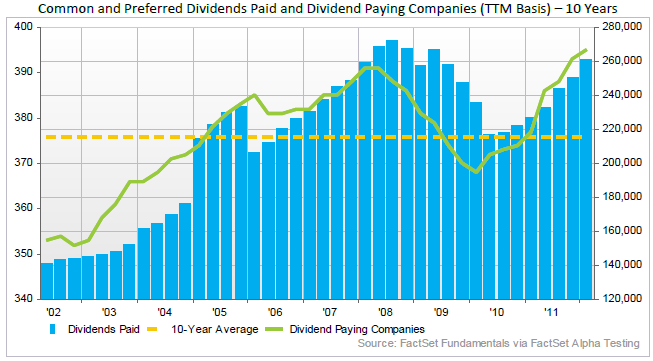
In a dividend report released by Factset this past Friday, it is noted the number of dividend paying companies in the S&P 500 Index has reached a 12-year high. The report notes,
"The number of dividend-paying companies was 393 at the end of Q4 2011 (January 2012), which marks a 12-year high. Aggregate quarterly dividend payments amounted to $260.8 billion over the trailing twelve months. On a per-share basis, the aggregate figure was $26.78 per share, reflecting year-over-year growth of 16.1%. The Financials, Materials, and Information Technology sectors led all sectors in year-over-year growth on a per-share basis (40.0%, 28.4%, and 23.5%, respectively)."
From The Blog of HORAN Capital Advisors

Interestingly, a majority (53.5%) of the companies in the technology sector now pay a dividend. This is up from only 17.9% in July of 2002, nearly 10-years ago. Is this a sign the technology sector is maturing?

We believe a primary reason for investors to look at a company's dividend practice is it provides insight into future expected earnings growth. And assuming a company is consistently growing its dividend at say a 10% rate, and all else being equal, that is, not borrowing to sustain the dividend growth rate and the payout ratio is not increasing, then the company's earnings are likely growing 10% as well. Over time the stock price should advance in line with the company's earnings growth rate. I am simplifying the analysis here as investors need to evaluate cash flow, etc. The Factset report, however, notes,
"a back test utilizing FactSet’s Alpha Testing application shows that stocks with the highest five-year compound annual growth rates in earnings per share have outperformed stocks with lower growth rates over fifteen years. However, the results for dividend per share (DPS) growth rates show a different relationship. Dividend paying stocks in the top quartile by DPS growth have underperformed the S&P 500 Total Return Index, while the lower three quartiles outperformed (emphasis added)."
If one removes the financial and health care sector stocks from the analysis, the top quartile dividend growers do exhibit the highest total return.

From The Blog of HORAN Capital Advisors

The negative influences to the health care and financial sector are well know, the housing bubble and heath care reform legislation. So just looking at dividend growth and investing based on this can be treacherous. Investors certainly need to evaluate macro factors that can negatively (or positively) influence a sector or stock's performance.

Companies in the S&P 500 index are now paying dividends at a record level after J.P. Morgan's (JPM) recent dividend announcement. This was noted recently by Howard Silverblatt, S&P's senior index analyst. The below chart is for the period ending 12/31/2011 and includes preferred dividends.

From The Blog of HORAN Capital Advisors

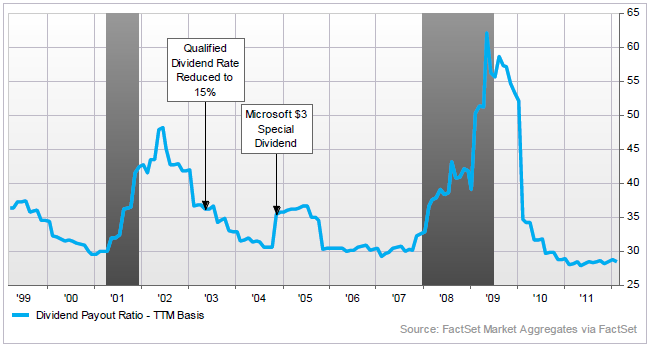
Lastly, given the level of cash on corporate balance sheets, and the still low payout ratio, future dividend growth looks promising.

From The Blog of HORAN Capital Advisors

Certainly, the change in the tax structure for dividend payments might be a headwind as noted in a recent Wall Street Journal article, Will A Dividend Tax Hike Spoil The Party? ($); however, the discipline of using dividend growth in ones stock analysis can be rewarding for even total return investors.

Source:

Factset Dividend Quarterly (PDF)
By: Michael Amenta, Research Analyst, John Butters, Senior Earnings Analyst
March 23, 2012
http://www.factset.com/websitefiles/PDFs/dividend/dividend_3.12/


Monday, March 19, 2012

The Disconnect Between The Economic Data And Sentiment

Recent unemployment data released by the Labor Department continues to indicate the economy is adding 200,000 jobs per month. This has been the case for the last three months. What is interesting about the continued job growth figures is the GDP growth rate is suggesting a much lower rate of job additions. A recent article in the Wall Street Journal, Piecing Together the Job-Picture Puzzle ($), notes the level of job improvement over the last year would indicate the economy is growing at a 4-5% pace. This projection is based on a study by Arthur Okun and is known as Okun's Law. The Fed has opined on Okun's Law and the relationship between output and unemployment. Mish's Global Economic Trend Analysis site highlights a comment from Madeline Schnapp, Director of Macroeconomic Research at TrimTabs Investment Research:
"Something about the U.S. economy isn't adding up.

At 8.3%, the unemployment rate has fallen 0.7 percentage point from a year earlier and is down 1.7 percentage points from a peak of 10% in October 2009. Many other measures of the job market are improving. Companies have expanded payrolls by more than 200,000 a month for the past three months, according to Labor Department data. And the number of people filing claims for government unemployment benefits has fallen.

Yet the economy is barely growing. Many economists in the past few weeks have again reduced their estimates of growth. The economy by many estimates is on track to grow at an annual rate of less than 2% in the first three months of 2012. The economy expanded just 1.7% last year. And since the final months of 2009, when unemployment peaked, the economy has expanded at a pretty paltry 2.5% annual rate.

How can an economy that is growing so slowly produce such big declines in unemployment?

TrimTabs thinks the problem lies in the heavily massaged BLS employment data and the highly suspect BEA personal income data.

That said, withholding tax data is also messy and not a perfect measure either, but no matter what I do with the data, I can't get to 200,000+ jobs unless a huge percentage of the workforce is suddenly working for McDonalds."
Recently, a number of consumer sentiment releases have turned negative. Last week's University of Michigan consumer sentiment index fell to 74.3 versus 75.3 in the prior month. Expectations were for an increase to 76. Additionally, the IBD/TIPP Economic Optimism Index declined to 47.5 versus 49.4 in February. This decline was the the index's first since August of last year. Readings below 50 indicate consumer pessimism. Both sentiment reports highlight gasoline prices as a prime contributor to the weaker sentiment figures.

From The Blog of HORAN Capital Advisors

TechnoMetrica's (TIPP) president, Raghavan Mayur, notes, "There is a basic disconnect between the media and the American public," he said, adding that coverage of the jobs picture has been too positive. "It's like there are two realities in this country. The report noted that 87.2% of those survey in the poll expect gas prices to top $4 over the next three months and 37.1 expect gas prices to reach over $5. It should be noted that all three of the components of the index worsened. The three components consist of:
  • The Six-Month Economic Outlook: a measure of how consumers feel about the economy’s prospects in the next six months.
  • The Personal Financial Outlook: a measure of how Americans feel about their own finances in the next six months.
  • Confidence in Federal Economic Policies: a proprietary IBD/TIPP measure of views on how government economic policies are working.
There certainly seems to be a disconnect from much of the reported economic data versus consumer/business sentiment.


Wednesday, March 14, 2012

Unlocking The Risk Associated With Stock Concentrations

Various techniques are available to investors in order to customize an effective approach to reducing a concentrated investment. Investors must continually evaluate the investment landscape, concentrated position risk, opportunity cost, time horizon and taxable consequence related to concentrated holdings. We recently prepared a report titled, Unlocking Concentrated Risk (PDF), that we feel is timely for investors as the market and individual stock prices have increased significantly since the market lows in September of 2011.


Wednesday, March 07, 2012

Is The Consumer's Financial Condition About To Worsen?

The consumer is the one important key to economic growth as they account for nearly 70% of GDP. Recent data does show consumer balance sheets have been improving based on the Fed's Financial Obligation Ratio.

From The Blog of HORAN Capital Advisors

Even consumer loan charge offs at commercial banks continue to show significant improvement.

From The Blog of HORAN Capital Advisors

The water on the fire though is the fact consumer delinquencies have recently turned higher. Is this a precursor to a less robust consumer spending environment? The fact gasoline prices have been on the rise as well is likely to reduce the cash available to consumers for discretionary spending.

From The Blog of HORAN Capital Advisors


Markets Retrace Significant Amount Of Losses Since Financial Crisis

The Chart of The Day charting service provides a graphic look at the market recovery for various indices since the financial crisis trough in March 2009.
"For some perspective on the post-financial crisis rally, today's chart illustrates how much of the downturn that occurred as a result of the financial crisis has been retraced by each of the five major stock market indexes. For example, the Dow peaked at 14,164.53 back in October 9, 2007 and troughed at 6,547.05 back on March 9, 2009. The most recent close for the Dow is 12,980.30 -- it has retraced 84.5% of its financial crisis bear market decline. As today's chart illustrates, each of these five major stock market indices have retraced over 78% of their financial crisis decline. However, it is the S&P 400 (mid-cap stocks) and the tech-laden Nasdaq that have recouped all the losses incurred during the financial crisis and currently trade higher than their 2007 credit bubble peak."
From The Blog of HORAN Capital Advisors


Monday, March 05, 2012

Risk On Trade Not Kind To Dividend Payers This Year

The dividend paying stocks in the S&P 500 Index have significantly lagged the performance of their non paying counterparts. The payers return in February and YTD have totaled 3.84% and 8.92% respectively. The non-payers on the other hand have generated February and YTD returns of 5.55% and 14.19% respectively.

From The Blog of HORAN Capital Advisors

One could say the market has been in a "risk on" mode this year and at least since the end of September last year. As we discussed this in our 4th Quarter Investor Letter the "risk on" "risk off" trade has been a common discussion item of late. Investors that desire to track the "risk on" and "risk off" cycles of the market are now able to follow the newly issued exchange traded notes with tickers "ONN" and "OFF". As the below charts show, these ETRACS notes came into existence in late 2011. Until the last few trading days, these indexes have shown the market has been mostly in a "risk on" mode. The question becomes whether the "risk off" trade exhibited over the last two to three trading days is one that will be sustained. If so, the dividend payers might regain some of the ground lost to the non-payers.

From The Blog of HORAN Capital Advisors


Saturday, March 03, 2012

Investor Equity Fund Flows Indicate They May Be Late To The Rally

Mutual fund flow data appears to indicate investors have been late to allocate additional funds to equities in spite of the strong equity market advance since the end of September last year. As the blue bar in the below chart indicates, monthly net flows into equity mutual funds has been negative in spite of the continued advance in the market.

From The Blog of HORAN Capital Advisors

The below chart shows the same data with flows accumulated on a rolling one year basis. Historically, when equity flows have been negative, the equity market returns have not been favorable. During this most recent period though, equity returns have been extremely strong in the face of the negative equity fund flows.

From The Blog of HORAN Capital Advisors

Not until this past month have equity fund flows turned positive. The biggest beneficiary of flows though has been fixed and money market funds.

From The Blog of HORAN Capital Advisors
Source: ICI

From The Blog of HORAN Capital Advisors

From a contrarian standpoint, and taking into account only the fund flow data, investors don't seem to have thrown in the towel and piled into equities.Maybe this market continues to climb the proverbial "wall of worry" until we see investors capitulate and plow into equities.