Monday, March 08, 2010

Market In Denial Phase Of Sentiment Cycle

A reader posted a comment/question on my article about February's performance of dividend payers versus non payers curious if the market sentiment is one where investors are in the denial phase of the sentiment cycle. Several articles today made reference to the fact investors are leery of the market at this stage, in part due to the strong advance off of the March 2009 lows.
Below is a 2-year chart of the S&P 500 Index (SPX) with notations that coincide with a chart that was first publish in 1991 by technical analyst Justin Mamis in a book titled The Nature of Risk. The chart depicts investor sentiment at various stages in the market's cycle.


The market will hit resistance at around the 1,150 level on the S&P 500 Index. Additionally, the recent advance has been occurring on lower volume that may be a sign of investors in disbelief regarding further advance at this point in the cycle.


In short, I believe investors appear anything but confident or enthusiastic at this juncture. Even fund flow data shows investors are placing more money into bond funds than into equity funds.


Monday, March 01, 2010

Dividend Payers' Return Lags Non Payers In February

The average performance of dividend paying stocks in the S&P 500 Index ($INX) underperformed the non payers in February, 4.15% versus 4.74%, respectively. On a year to date basis, however, the payers are outperforming the non payers, 1.57% versus -.24%.

dividend payers versus non payers performance February 2010With respect to dividend actions, February was a much improved environment compared to February of 2009. February tends to be the busiest month for dividend news and the S&P 500 index companies saw 45 increases versus just 30 in the same period last year. Additionally, there were no dividend decreases in February versus 18 decreases in February 2009. For the three month period ending in February, there were 79 positive announcements and just two reductions versus 58 positive announcements and 41 reductions for the same period in 2009.


Source: Standard & Poor's


The Market Is Like A Puzzle

As one puts together a puzzle certain pieces will fit and others won't depending how far along one is in completing the puzzle. Investments aren't much different. Certain types of investments will fit into ones portfolio based on where the economy is in the economic cycle.

I read an interesting post today by Tadas Viskanta, the author of the site Abnormal Returns. His post titled, Play the Ball where it Lies, offers an interesting perspective for investors as they evaluate buy and hold decisions. One premise in the article notes that the markets are rarely "normal" so an investor needs to know why they are making specific investment decisions. At the end of the day, an investor should know why they own what they own. The brief article is a worthwhile read.


Sunday, February 28, 2010

Dividends Will Be A Company's Renewed Focus?

Money manager Neil Hennessy of the Hennessy Funds believes companies will reward shareholders by initiating or increasing dividend payments. In the below video Hennessy explains why he believes company managements will have a heightened focus on dividends.


Saturday, February 27, 2010

Berkshire Hathaway's 2009 Annual Letter Is Out

The much anticipated 2009 Berkshire Hathaway (BRK.A) annual letter to shareholders, written by Warren Buffett, is now available on the company's website. This letter is always an interesting read by investors. I anticipate noting my thoughts on the letter later this weekend. The PDF version of the annual letter can be accessed on Bershire's Hathaway's website.


Thursday, February 25, 2010

The Impact Of Rising Interest Rates On Stocks And Bonds

One thing that seems almost certain is the next move in interest rates will be a move higher. What will a move higher in interest rates mean for stock and bond investors?

It should be noted longer term market rates have already been trending higher over the past twelve months. The 30-year U.S. Treasury rate has increased from around 3.5% a year ago to 4.6% today. Short term rates, i.e., the 1-month Treasury rate, has actually declined from around .20% a year ago to .08% today. In other words the yield curve has steepened. But back to the original question.

For a bond investor, higher interest rates will have a negative impact on the price of a bond or price of a bond mutual fund. The impact of this "interest rate risk" depends on the maturity or duration of a particular bond. In its simplest form, the duration indicates how much the price of a bond or price of a bond mutual fund will change given a 1% or 100 basis point change in interest rates. For example, if the duration of the bonds in a bond mutual fund is 5 years, then the price (NAV) of the bond fund will decline 5% (increase) for a 100 basis point increase (decrease) in interest rates. The question for investors then is how long does it take to recover the loss in principal.

In a recent research article from Charles Schwab (SCHW) titled, Should You Worry About Bond Funds if Interest Rates Rise?, it is noted that,
"More than 90% of the total return since 1976 generated from a broadly balanced portfolio of US investment-grade Treasury, agency and corporate bonds has come from interest payments as opposed to change in price..."
If an investor understands the recovery time, they will then know if their time horizon matches the term or duration of the bonds or bond fund.

For stocks they tend to perform better in declining interest rate environments as well. Unlike bonds though, on average, stocks have generated positive returns in rising interest rate environments as well as in declining rate environments. Although stock returns have tended to be positive in periods where interest rates have increased, the better returns are found in declining interest rate periods.

In Standard & Poor's article, Rising Rates Revisited, they include returns be S&P 500 sector as well.

For investors then, if one believes interest rates will trend higher over a period of time in which it will be necessary to access the principal invested, paying attention to the duration of an investment as well as the types of stocks within a portfolio will be important.

Source:

Should You Worry About Bond Funds if Interest Rates Rise?
Charles Schwab & Co.
By: Rob Williams
February 24, 2010
http://tinyurl.com/ylbmaeu

Rising Rates Revisited
Standard & Poor's
By: Sam Stovall
February 19, 2010
http://tinyurl.com/23j6med


Sunday, February 21, 2010

Investor Fund Flows Favoring Fixed Income Investments

The below chart notes the change in fund flows for the broad mutual fund asset classes of equity, fixed and money market funds. If the line is above the "zero" x-axis, then the respective asset class saw positive fund flows for the period in question. For the periods earlier than 2010, the data is monthly.

The chart shows fixed income funds have generated positive investment flows since September of last year. During that same time period, equity funds saw outflows except for a brief period in early January of this year. The negative flow in money market cash has been driven mostly by institutional investors. Retail investors have actually added to their money market funds since the beginning of February. Is this a contrarian sign?


Investors interested in reviewing the data for a longer time period, the Investment Company Institute website contains more detail on flow data.


Wednesday, February 17, 2010

2010 Dogs Of The Dow Performance Update

The year to date performance of the 2010 Dogs of the Dow are slightly ahead of the Dow Jones Industrial Average Index. As the below table indicates, the best performing Dow dog is Boeing (BA) with a YTD return of 14.2%. The worst performing dog is Verizon (VZ) returning a negative 12%. In 2009, the Dow Dogs slightly underperformed the Dow Index, 17.8 versus 18.8, respectively.


The "Dogs of the Dow" investment strategy is one where an investor ranks the thirty Dow Jones Industrial Average members by yield, highest to lowest, based on the last trading day of the prior year. An investor then invests an equal amount in the ten highest yielding Dow stocks and holds them for one year. More information on the Dogs of the Dow investment strategy and other variations on the strategy can be found at a website devoted to Dogs of the Dow investing.


Sunday, February 14, 2010

4 Dividend Increases Earlier This Month

February is the busiest month for dividend increases and below is detail on four companies increasing their payouts earlier this month.


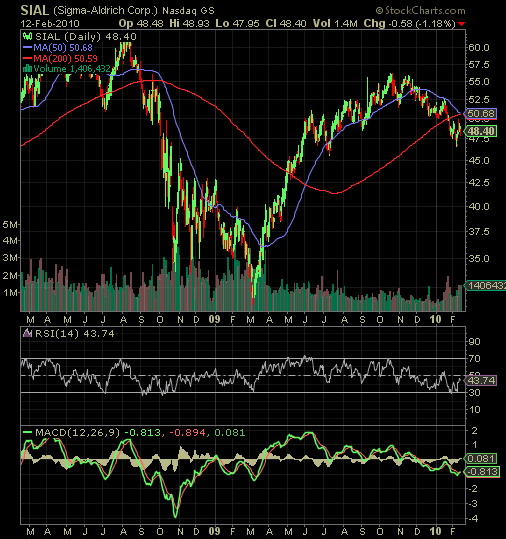
Sigma-Aldrich (SIAL)
  • announced a 10.3% increase in the quarterly dividend to 16 cents per share versus 14.5 cents per share in the same quarter last year.
  • based on 2010 estimated earnings per share of $3.14, the projected payout ratio is 20%. This compares to the 5-year average payout ratio of 20%.
  • SIAL carries an S&P Earnings & Dividend Quality Ranking of A+ and is one of S&P's Dividend Aristocrats.

United Technologies (UTX)
  • announced a 10.4% increase in the quarterly dividend to 42.5 cents per share versus 38.5 cents per share in the same quarter last year.
  • based on 2010 estimated earnings per share of $4.60, the projected payout ratio is 37%. This compares to the 5-year average payout ratio of 27%.
  • UTX carries an S&P Earnings & Dividend Quality Ranking of A+.

Archer-Daniels Midland (ADM)
  • announced a 7.1% increase in the quarterly dividend to 15 cents per share versus 14 cents per share in the same quarter last year.
  • based on June 2010 estimated earnings per share of $2.96, the projected payout ratio is 20%. This compares to the 5-year average payout ratio of 18%.
  • ADM carries an S&P Earnings & Dividend Quality Ranking of A and is one of S&P's Dividend Aristocrats.

Bemis (BMS)
  • announced a 2.2% increase in the quarterly dividend to 23 cents per share versus 22.5 cents per share in the same quarter last year.
  • based on 2010 estimated earnings per share of $1.92, the projected payout ratio is 48%. This compares to the 5-year average payout ratio of 49%.
  • BMS carries an S&P Earnings & Dividend Quality Ranking of B+ and is one of S&P's Dividend Aristocrats.


Disclosure: Long interest in UTX.


Saturday, February 13, 2010

The Value Is In Quality

For the period between the March low in 2009 and year end 2009, low quality stocks drove the market's move higher last year. The better return that was achieved in the lower quality equity assets in 2009 versus 2208 also occurred in other asset classes as detailed below.
Riskier Assets Outperform

With respect to stocks at this point in time, “If you go farther down on the quality scale, you are not getting a valuation discount,” said Cathy Seifert, head of financial services equity analysis at S&P. As noted in a number of my earlier blog posts, S&P's Quality Ranking measure looks at the growth and stability of a company's earnings and dividends over the prior 10-year period. S&P's research has noted that companies with above average quality rankings tend to outperform over the long run.

"S&P believes that high-quality stocks offer both increased safety of principal and potentially higher long-term returns versus low-quality issues,” says Richard Tortoriello, an S&P equity analyst. “We believe the recent market pull-back offers investors an opportunity to participate in a cyclical bull market. We would favor high-quality issues at this point."

A partial list of the stocks that carry S&P's 4 or 5 STAR rating and also have a buy rating by an S&P analyst is detailed below.


Disclosure:
Readers should assume I have a long interest in each company on the above list and/or may be selling an investment in one or more of the above companies at anytime.


Thursday, February 11, 2010

Conflicting Investor Sentiment Data

The sentiment data reported this week by the American Association of Individual Investors and Investors Intelligence is somewhat conflicting. The individual investor bullish sentiment as reported by AAII shows bullish sentiment rose to 36.75% versus last week's reading of 29.23%. Most of the increase in bullish sentiment came from those investors that were neutral last week. The neutral reading fell over six percentage points. On the other hand, the Investor Intelligence results show:
"bullish sentiment among newsletter writers is currently at 34.1%, which is the lowest level since March 2009. At the same time, bearish sentiment (26.1%) is the highest since November, while the percentage of newsletter writers in the correction camp has sky-rocketed all the way to 39.8%, which is a level that hasn't been seen since 1983," as reported by Bespoke Investment Group.


Tuesday, February 09, 2010

S&P 500 Index Finding Support

Just returned from several days of travel out of town visiting clients in Charleston, S.C. The city of Charleston is rich with history. I must say though, traveling by air is becoming less fun. Getting to a destination seems to take an entire day if you need to change planes along the way, which I had to do. Throw in some weather related delays and that just adds a little more to the travel adventure.

The market continues to look for direction in the face of the negative news related to sovereign debt issues in Greece. Today's market advance came on the back of a potential resolution of the debt crisis with the EU maybe stepping in to provide some support. The downside to this is the lack of moral hazard. As noted in a recent issue of The Economist magazine,
"A messy Greek default would harm almost everybody. As markets and governments know only too well, behind Greece stand others: Portugal, Ireland, Spain and even Italy, the world’s third-biggest sovereign debtor."
Back to the market. The S&P 500 Index (SPX) is attempting to find support around the 150 day moving average. The 200 day moving average is around 1,020. Since late January, the downside volume has been steadily decreasing with volume on up days staying level or trending slightly higher.


The market does appear oversold in the short run. The percentage of S&P 500 stocks trading above their 50-day moving average has declined to 22%. At the beginning of the year, this percentage reached nearly 95%.


Earnings reports for the 4th quarter have been coming in relatively strong. Rightfully so, the market has been focused on top line revenue results. Revenues have been coming in ahead of expectations, but still below year ago levels.


Sunday, February 07, 2010

Catching Up On A Few Dividend Increases From Last Week

Last week saw a number of companies announce increases in their dividends. Two notable increases were from L-3 Communications (LLL) and Colgate Palmolive (CL).

L-3 Communications and Colgate Palmolive dividend analysis table
L-3 Communications
  • announced a 14% increase in the quarterly dividend to 40 cents per share versus 35 cents per share in the same quarter last year.
  • based on 2010 estimated earnings per share of $8.15, the projected payout ratio is 20%. This compares to the 5-year average payout ratio of 16%.
  • LLL carries an S&P Earnings & Dividend Quality Ranking of A-.

Colgate-Palmolive
  • announced a 20% increase in the quarterly dividend to 53 cents per share versus 44 cents per share in the same quarter last year.
  • based on 2010 estimated earnings per share of $4.85, the projected payout ratio is 45%. This compares to the 5-year average payout ratio of 45%.
  • CL carries an S&P Earnings & Dividend Quality Ranking of A+.


Thursday, February 04, 2010

Decline In Bullish Investor Sentiment Continues

Today's release of the American Association of Individual Investor's sentiment survey shows individual investors continue to become less bullish on the market. The current bullishness level takes the bullish sentiment level near one standard deviation below the bullishness average. The bull/bear spread is reported at -14% versus last week's spread of -2%. As this is a contrarian indicator, this is one indicator that suggests the market could be in store for a bounce?


Tuesday, February 02, 2010

Dividend Payers Outperform Non Payers In January

For the month of January 2010, dividend payers in the S&P 500 Index ($SPX) outperformed non payers. January saw the Index decline 3.70% compared to the payers' decline of 2.48% and the non payers' decline of 4.75%. This past January was the first in the last three years where there were no dividend decreases or dividend suspensions for companies in the S&P 500 Index (updated 2/3/2010: Valero (VLO) reduced its dividend 66% in January). In declining markets, dividend paying stocks, and especially dividend growers, tend to hold up better than the overall market.


Friday, January 29, 2010

Urban Outfitters Being Added To S&P 500 Index

Today S&P announced that Urban outfitters (URBN) will be added to the S&P 500 Index on a specific date to be announced in the future. URBN is replacing Affiliated Computer Services (ACS) as ACS is being acquired by Xerox (XRX) and is pending approvals.

(click to enlarge)

Urban Outfitters table replacing Affiliated Computer Services in S&P 500 Index


Thursday, January 28, 2010

S&P 500 Index Short Term Oversold

The percentage of stocks in the S&P 500 Index trading above their 50 day moving average has declined to 34%. This percentage is approaching levels last reached mid year of last year. The percentage of S&P 500 stocks trading above their 150 day moving average remains at a high level of 75%.


Investors Increasingly More Bearish

Since the end of last year, the trend in individual investors sentiment has turned more bearish. This more bearish sentiment shows in the bull/bear spread declining from +26% at the end of 2009 to -2% this week. Bullish investor sentiment this week came in at 35% and is the lowest level since August last year when the bullishness reading was reported at 51%.

Barry Ritholtz of The Big Picture website comments on sentiment this week as well. He notes in his post referring to asset allocation, American Association of Individual Investors (AAII) Equity Allocations, Deviation versus 21-Year Mean:
"while not as ample [liquidity] as near the lows buying power still remains adequate to power/move stocks higher and keep corrections fairly well contained."

Source: American Association of Individual Investors


Tuesday, January 26, 2010

S&P 500 Finding Support At 1,091 Level?

The S&P 500 Index ($INX) seems to be testing support at the 1,091 level over the past several trading days. This same level was reach in early November and early December. At the same time downside trading volume does seem to be losing momentum. Given the strong market advance since March of last year and elevated investor bullish sentiment, investors might want to focus on lower valuation stocks with lower PEGs (P/E to growth rate) and lower debt levels.


Sunday, January 24, 2010

A Decline In Bullish Investor Sentiment

Last week bullish investor sentiment declined to 40% from the prior week's sentiment level of 47.44%. The decline in bullish investor sentiment nearly matched the increase in bearish sentiment. The bearish sentiment reading came in at 34.74% versus last week's 26.92%. The result of these sentiment changes is the bull/bear spread fell to 5% from last week's spread of 21%. Since the release of the sentiment data by the American Association of Individual Investors, the S&P 500 Index has declined 4.1% to 1,91.76.


With this decline in bullish sentiment and decline in the S&P 500 Index, can the market find support at the 1,086 level?


Saturday, January 23, 2010

High Yield Spreads Near Long Term Average

During the depths of the financial crisis last year, high yield spreads widened to near record levels. Spreads in early 2009 approached nearly 2000 basis points. Since that time spreads have narrowed to near their long term average just below 600 basis points.

One question many high yield investors are asking is whether the strong returns in this fixed income segment are behind us. Certainly, the 58% return achieved in the Merrill Lynch High Yield Master II Index in 2009 is not likely to be repeated in 2010. However, as the below chart shows, the spread tends to continue tightening beyond the long term average as the economy improves. Given the low interest rate environment for cash and investment grade debt, investors may continue to chase high yield resulting in further spread tightening.
High Yield Spread 12 2009


Decade Returns Are Strong Following Decades Where Returns Are Weak

The decade of 2000s is now being referred to as the "lost decade". This past decade was only the second one to record a negative return since the negative returning decade of the 1930s. Strong equity market returns tend to follow decades that recorded weak returns. For example, after the worst 10-year periods in the 1930s and 1970s, the market rose 9% and 15%, respectively, on an annual basis over the next decade.

An important factor for investors to consider is to establish an appropriate risk tolerance and time horizon for their investments as the stronger returns can occur later in the decade. The second slide in the below report displays the 10-year rolling returns for the S&P 500 Index since the 1930s.
Lost Decade


Thursday, January 21, 2010

Comprehensive Review Of The Dividend Aristocrats

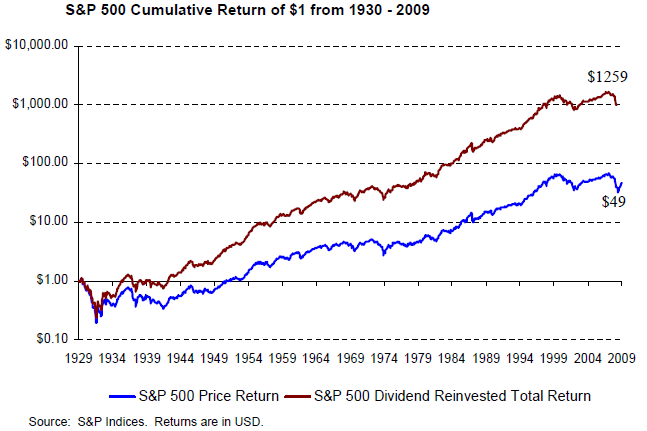
There tends to be much debate on whether dividends are a critical factor in determining the suitability of a particular investment. One fact is clear though and that is since 1926 the dividend component of the S&P 500 has accounted for one-third of the index's total return. As you read further in this post, Dividend Aristocrats have outperformed the S&P 500 Index on both a return basis and with less risk (beta).


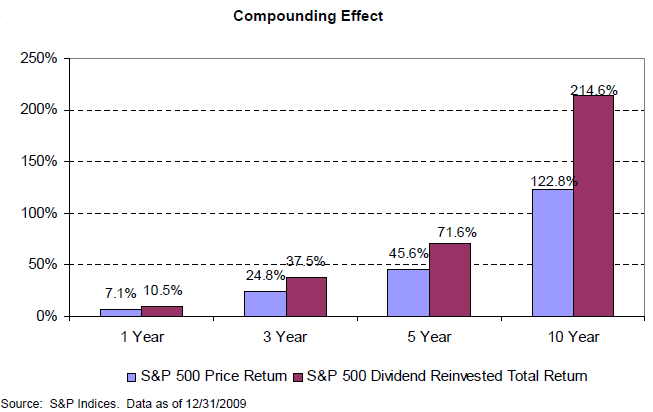
The two charts below show the cumulative return of a dollar for the S&P 500 Index on a price only basis and total return that includes reinvested dividends since 1926. The second chart shows the power of compounding on a percentage basis.


An important factor to review in selecting dividend growth stocks is S&P's Quality Ranking. Standard & Poor's states:
The ability of management to maintain stable or increasing dividends indicate the quality of the firm’s earnings and its growth prospects. The S&P Common Stock Ranking systems, for over 40 years, ranks stocks in categories based on growth and stability of earnings and dividends. [The below chart shows] ...the distribution of quality ranks of the constituents of the S&P 500 Dividend Aristocrats against those of the S&P 500 Index.
Given the strong market returns in 2009, one potential advantage to investing in dividend growth equities and specifically the Dividend Aristocrats, is the Aristocrats tend to outperform the market in down markets. Many are calling for a market correction and the past several days are providing support for that line of thinking. As the below table shows the Aristocrats not only outperform the S&P 500 Index over 3, 5, 10 and 15 year time periods, the Aristocrats outperform while exhibiting less risk. That is the standard deviation of returns is lower for the Aristocrats as compared to the S&P 500 Index.


The calendar year returns going back to 1998 are outlined in the chart below. In down markets the Aristocrats achieve significant outperformance relative to the market.


The math behind compounding shows if one losses less in a down market, it takes a lower return to get back to even. In essence, if one losses less in the down market period, the portfolio will have more invested when the market turns around and moves higher.


Finally, one thing investors need to keep in mind as it relates to the Aristocrats is the 43 stocks that comprise the Aristocrats in 2010 result in some sector overweights and underweights. As an example, the technology weighting is a little over 2% for the Aristocrats and the S&P 500 Index weighting is over 19%. For the staples sector, the Aristocrats list is 23% while the S&P 500 Index is 11%. Therefore, investors need to perform their own research before investing in any stock or buying into any particular strategy like a dividend focused one.


Source:

S&P 500 Dividend Aristocrats
Standard & Poor's
By: Aye M. Soe and Dave Guarino
PDF via .docstoc


Wednesday, January 20, 2010

S&P 500 Sector Earnings Growth For 2010

All sectors in the S&P 500 index are expected to contribute to earnings growth in 2010. Overall earnings growth for the S&P in 2010 is estimated to be 36%. Several keys for the market will be a company's top line results, the level of earnings vis-à-vis earnings expectations and especially company comments on their forward outlook.


Data Source: Standard & Poor's


Monday, January 18, 2010

Sentiment, Earnings and Asset Allocation: Making Sense Of The Data

In an effort to understand the potential direction of the overall market, one of many factors I look at is the investor sentiment data. A number of other strategist review this same data. The reason for including this variable in ones criteria for determining the future direction of the market is individual investors tend to plow into stocks at the top of the market. Consequently, high bullish investor sentiment could signal a market that is near its top.

The individual sentiment data reported last week by the American Association of Individual Investors shows bullish investor sentiment rose over six percentage points to 47.4% from last week's bullish sentiment reading of 41%. This reading is below the average plus one standard deviation of the bullish sentiment reading. The 8-period moving average of the bullish sentiment reading increased to 43% from 42% last week. At the market top near the beginning of 2000, the 8-period average was in the high 50's and even hit 60 at one point. In short, sentiment is elevated, but does not seem to be at an "extreme" level yet.


What about investor asset allocations? Again, AAII allows investors to note their overall asset allocation on a monthly basis on the organization's website. The December allocation is reported at 64%/18%/18% (equity/bonds/cash). Going back to late 1997, the long term average allocation is 60%/15%/25%. Given the low interest rate environment, it seems reasonable that investors would have lower allocations to bonds and cash. Additionally, the magnitude of the equity market's advance last year will force down the weighting of the bonds and cash simply because of the market growth in equities. Again, going back to 1997, the maximum equity allocation reported by AAII is 77% and the lowest reported cash level is 11%. As with the sentiment data, I do not view asset allocations at "extreme" levels.


Finally, what do earnings for the S&P 500 Index look like for 2010? Standard & Poor's is reporting the estimate for bottom up operating earning on the S&P for 2010 is $76.37. This represents a nearly 37% increase over the final estimate for 2009 of $55.79. The 2010 projected P/E for the market is just under 15. Now I know there is more to valuing the market and/or companies than simply looking at the P/E ratio; however, this broad valuation measures does not seem to be at "extreme" levels either. Another way to look at the market's P/E is Robert Shiller's method where the market P/E is based on average inflation-adjusted earnings from the previous 10 years. This methodology indicates the current market P/E is 20.6, essentially in line with the 2009 year end estimate provided by S&P.


One key to the market's future direction is to answer the question of how likely is the market to achieve the earnings results that are projected. There are several variables that could derail the earnings that are projected. I believe two significant variables are:
  1. how likely is the financial sector to incrementally grow 2010 earnings by $8 per share on average, and
  2. how will Washington policies: cap and trade, health care, etc., impact company earnings
Nearly all of the policies being proposed in Washington add expenses to companies not to mention the impact on state budgets. At a time when the economic recovery seems fragile, these added expenses are not likely to be positive for corporate earnings or municipal budgets.

Much is made of the benefit of running deficits during economic slow periods. In 1937, the Roosevelt administration and the Federal Reserve reversed liquidity measures taken to fight the Depression. This is thought to have resulted in the double dip during that time period in addition to some other factors that were not pro-business (see my post, Positive Equity Market Returns Probable In 2010). The key though is how is the deficit money being spent. The deficit funds need to be spent in productive ways that create an environment that put the jobless back to work in the private sector and not the government sector.

In summary, sentiment and allocation data appear elevated but not at extremes. At the same time the market's forward valuation does not appear too stretched. This does not mean dive head first into the market. Being selective in the companies one invest in could still provide adequate returns in 2010, but not without experiencing some volatility.


Sunday, January 17, 2010

Current Dow Rally Below Average In Magnitude And Duration

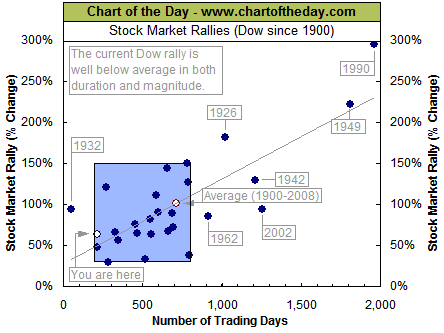
As a follow up to my post yesterday, Positive Equity Market Returns Probable In 2010, the current advance in the Dow Jones Industrial Average (^DJI) is below average in both magnitude and duration as compared to past rallies. The Chart of the Day chart service looked at the prior 27 market rallies since 1900. They note:
  • most major rallies (73%) resulted in a gain of between 30% and 150% and lasted between 200 and 800 trading days.
  • the current Dow rally (hollow blue dot labeled you are here) has entered the low range of a "typical" rally and would currently be classified as both short in duration and below average in magnitude.

If company earnings reports meet or exceed expectations on the whole this reporting period, the market could continue to grind higher.


Saturday, January 16, 2010

Positive Equity Market Returns Probable In 2010

Given the magnitude of the market's advance in 2009 and more specifically off of the March low, what does history suggest for the coming year? As the below chart details, the 65% return for the S&P 500 Index from 3/9/2009-12/31/2009 is the second best return period for the market during the first year of a bear market recovery. The only higher period is the 124% return achieved in the 1929 - 1932 period.

Source: Fidelity Investments-Room For Stocks To Run?

The red circle on the chart highlights the fact the market remains 29% below the 2007 high. The average for the prior bear market periods is -14% with the median equaling -8%. This market cycle seems most similar to the 1937 - 1942 period from a return perspective. This being the case then, positive but muted returns are probable in 2010. In a low return environment, dividends will be an important part of investor returns.

If the market is similar to the 1937-1942 period, investors might want to be cognizant of policies that impacted the market and economy during the '37-'42 time period. I must say I am not in agreement with some of the author's conclusions in the article at the previous link (like continued deficit spending). What is important for investors is to understand the policies that were instituted at that time that may have prolonged the recession during that period--like the Wagner Act. Some of the policies out of Washington today look similar and could derail the recovery past 2010.


Thursday, January 14, 2010

Highest Yielding Stocks In The S&P 500 Index Best In The Long Run

A recent article in Kiplinger magazine by Jeremy Siegel, Scoop Up Dividends, notes the highest yielding dividend payers in the S&P 500 Index have outperformed the lowest yielding dividend payers going back to 1957. In Siegel's research he points to the fact:
"If an investor had put $1,000 in a portfolio of the 100 highest-yielding stocks on January 1, 1957, by December 1, 2009, he would have accumulated more than $450,000 (assuming all dividends were reinvested). That’s a hefty annualized return of 12.5%, an average of almost 2.5 percentage points per year greater than the return on the S&P index. That same $1,000 invested in the 100 lowest-yielding stocks returned only 8.8% per year."
As I have noted in past posts, the absolute dollar amount of dividends in 2009 has declined significantly. Most of the decline has occurred in the financial sector. The article notes,
  • for 2007, at the height of the bull market, the dividend stream -- total dividends paid on all U.S. stocks -- was $288 billion.
  • for 2009 through November, the dividend stream had dropped to $216 billion -- the greatest decline in that measure since the end of World War II
  • the entire decline in dividends can be attributed to the financial sector, which cut its total payouts by $79 billion over the past two years. (Siegel includes General Electric because GE’s dividend reduction was caused solely by the losses at GE Capital.)
  • in other sectors of the economy -- energy, health care, technology, consumer discretionary, consumer staples, telecom -- dividends have actually risen over the past two years, even with the recession.
Although Jeremy Siegel cites the higher return of the highest yielders, investors should perform their own due diligence and not chase yield blindly. The dividend paying stocks in the S&P 500 Index can be found at indexArb's website.

Source:
Scoop Up Dividends
Kiplinger Magazine
By: Jeremy Siegel
February, 2010
http://www.kiplinger.com/columns/goinglong/archives/scoop-up-dividends.html


Linear Technology: Buy The Rumor Sell The News

After the market close on Tuesday, Linear Technology (LLTC) reported better than expected earnings for the company's second quarter ending 12/31/2009: 33 cents per share versus an estimate 30 cents per share. On Wednesday the stock proceeded to trade down 1.2% to $29.87 with pretty good volume on the positive earnings news.

In the company's earnings release, they also announced a 4.5% increase in the quarterly dividend to 23 cents per share versus 22 cents per share in the same period last year. The company has increased its dividend each year since it first began paying one in 1992. The projected payout ratio using an average of the June 2010 year end earnings estimate ($1.24) and the June 2011 earnings estimate ($1.51) is 67%. The payout ratio trend continues to move higher with the 5-year average payout ratio equaling about 43%. The company does maintain an S&P Earnings & Dividend Quality Ranking of A-.


Sunday, January 10, 2010

Investor Sentiment Near Long Term Average

The American Association of Individual Investors reported bullish investor sentiment fell eight percentage points last week. The bullish sentiment reading came in at 41% versus the prior week's 49.18%. Last week's reading is near the long term average of 39%. Additionally, the bull/bear spread narrowed to 15% versus the prior week spread of 26%. In spite of the bullish sentiment decline, the 8-period moving average increased for the 5th straight week to 42.3%.


Essentially No Job Growth In Last Decade

Last week the labor department noted December non-farm payrolls fell by 85,000. This was a much larger decline than consensus estimates. This capped off a decade in which non-farm payrolls were nearly unchanged from the beginning of the decade. As the below chart notes, this is the first decade since the 1940's that job growth did not exceed 20% from the beginning to end of the period.


Friday, January 08, 2010

Washington's Policies On Jobs Misguided

Whether eligible voters voted for President Obama in the last election or not, all voters need to pay attention to the policies being pursued in Washington. Most are not creating an environment that is conducive to business and/or job creation.

Today's jobs report noted companies shed 85,000 jobs in December versus consensus expectations of a 10,000 job loss figure. Additionally, the work force declined 661,000 showing the jobless are giving up. When discouraged workers and part-time workers who would prefer full-time jobs are included, the so-called "underemployment" rate in December rose to 17.3% from 17.2% in November. This is near the record high reported in October of 17.4%.

As reported by ABC News, the administration's response to these job numbers was the implementation of a green jobs program.
"Obama announced the awarding of $2.3 billion in tax credits to companies that manufacture wind turbines, solar panels, cutting edge batteries and other green technologies. The money will come from last year's $787 billion stimulus program. He also renewed a call by Vice President Al Gore for Congress to approve an additional $5 billion to help create more such jobs."
What kind of success has been experienced by other countries that have modeled job growth on a "green" basis? President Obama often cites the Spain model.

A study released early last year by Dr. Gabriel Calzada, an economics professor at Juan Carlos University in Madrid, said the United States should expect results similar to those in Spain:
"Spain’s experience (cited by President Obama as a model) reveals with high confidence, by two different methods, that the U.S. should expect a loss of at least 2.2 jobs on average, or about 9 jobs lost for every 4 created, to which we have to add those jobs that non-subsidized investments with the same resources would have created,” wrote Calzada in his report: Study of the Effects on Employment of Public Aid to Renewable Energy Sources"
According to the Cybercast News Service, it is noted,
"in the study’s introduction Calzada argues that the renewable jobs program hindered, rather than helped, Spain’s attempts to emerge from its recession."

“The study’s results show how such 'green jobs' policy clearly hinders Spain’s way out of the current economic crisis, even while U.S. politicians insist that rushing into such a scheme will ease their own emergence from the turmoil,” says Calzada. “This study marks the very first time a critical analysis of the actual performance and impact has been made."

Pat Michaels, professor of environmental sciences at the University of Virginia and senior fellow in environmental studies at the Cato Institute, a free market group, told CNSNews.com that the study’s conclusions do not surprise him. He added that the United States should expect similar results with the stimulus money it spends on green initiatives.

Michaels also said he was not surprised by the study’s finding that only one out of 10 jobs were permanent.
h/t: Michelle Malkin: Spain’s green jobs boondoggle
and Here comes another multi-billion-dollar Green Jobs boondoggle


Thursday, January 07, 2010

Dividend Actions Largely Negative In 2009, Dividend Growth To Resume In 2010

Standard & Poor's reported 2009 dividend results for the approximately 7,000 companies that report dividend information to S&P. According to Howard Silverblatt, Senior Index Analyst for S&P,
  • 804 companies cut their dividend payments in 2009 which was a 631% increase over the 110 companies that cut their dividends in 2007.
  • In absolute dollars, the cuts represented $58 billion in reduced dividend income.
From a positive perspective, for the S&P 500 Index, negative dividend actions in the 4th quarter of 2009 of 74 were substantially lower than the 288 negative actions in the 4th quarter of 2008. Additionally, positive actions finally turned higher in the quarter totaling 484 versus 475 in Q4 of 2008.


There has been a shift in the composition of the top dividend payers in the S&P 500. Many of the past top payers were financial stocks where financials made up over 20% of the dividend income, they now account for only 9%.


The current top payers (over $5 billion) are:
  • AT&T ($9.9 billion rate)
  • Exxon ($8.0 billion)
  • Pfizer ($5.8 billion)
  • Chevron ($5.5 billion)
  • Johnson & Johnson ($5.4 billion)
  • Verizon ($5.4 billion)
  • Procter & Gamble ($5.1 billion)
S&P's initial estimate for dividends in 2010 is about $23.67. This is 5.6% higher than 2009's dividend estimate of $22.31. If history is any guide, dividends will be an important part of an investor's return in 2010. Since 1926, dividends have accounted for 40% of the S&P's total return. This may be the case for returns in 2010.

Source:
2009 Worst Year Ever For Dividends;
Expects 2010 to Show Steady Improvement

Standard & Poor's
By: Howard Silverblatt
January 7, 2009
http://www.businessweek.com/investing/insights/blog/Worst_year_for_dividends_2009.doc


Tuesday, January 05, 2010

Easy Money Was Made In 2009

As noted in several of my prior posts over the last week or so, 2009 was one in which it seemed nearly all equities moved higher. As a result, indexing would have been a rewarding strategy for the last year of this past decade. Howard Silverblatt, Senior Index Analyst at Standard & Poor's notes the following detail about 2009,
  • 425 issues were up with an average return of 51.4%
  • 73 issues were down with an average return of -14.3%.
The below table provides a little more detail on the top performing issues.


Dividend Payers Underperformed In 2009

As the below table notes, the dividend payers in the S&P 500 Index underperformed the non-payers by a wide margin in 2009. In looking at the 4-year annualized return for the payers, non-payers and the S&P 500 Index, it is the payers that are the underperforming asset class. The non-payers large outperformance in 2009 is impacting the 4-year return results. For contrarians, as 2010 unfolds, maybe the market will finally reward the dividend payers as this coming year unfolds.


Saturday, January 02, 2010

Mid Term Election Year Market Returns

Now that we are beginning a new decade and one that is a mid term election year, how has the market performed in past mid term election periods? As the below chart notes, the first three quarters of the year tend to be flat and choppy with a rally in the last quarter. This chart is simply another data point that might suggest stock picking wins out in 2010 versus an index strategy as noted in several of my posts over the course of the past week.

(click to enlarge)