Sunday, January 24, 2010
A Decline In Bullish Investor Sentiment
Posted by
David Templeton, CFA
at
4:44 PM
0
comments
Labels: Sentiment , Technicals
Saturday, January 23, 2010
High Yield Spreads Near Long Term Average
During the depths of the financial crisis last year, high yield spreads widened to near record levels. Spreads in early 2009 approached nearly 2000 basis points. Since that time spreads have narrowed to near their long term average just below 600 basis points.
One question many high yield investors are asking is whether the strong returns in this fixed income segment are behind us. Certainly, the 58% return achieved in the Merrill Lynch High Yield Master II Index in 2009 is not likely to be repeated in 2010. However, as the below chart shows, the spread tends to continue tightening beyond the long term average as the economy improves. Given the low interest rate environment for cash and investment grade debt, investors may continue to chase high yield resulting in further spread tightening.
High Yield Spread 12 2009
Posted by
David Templeton, CFA
at
3:49 PM
0
comments
Labels: Bond Market
Decade Returns Are Strong Following Decades Where Returns Are Weak
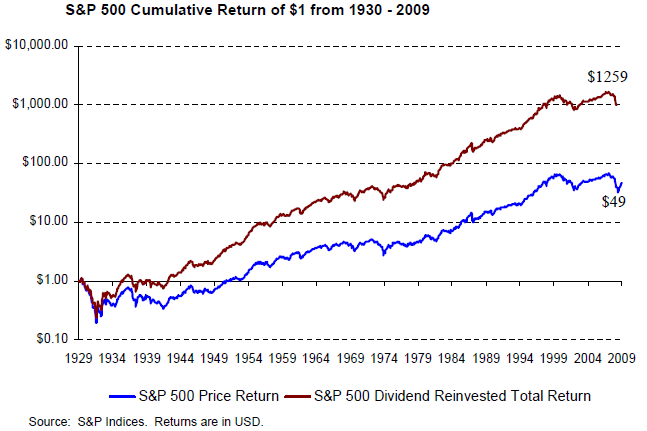
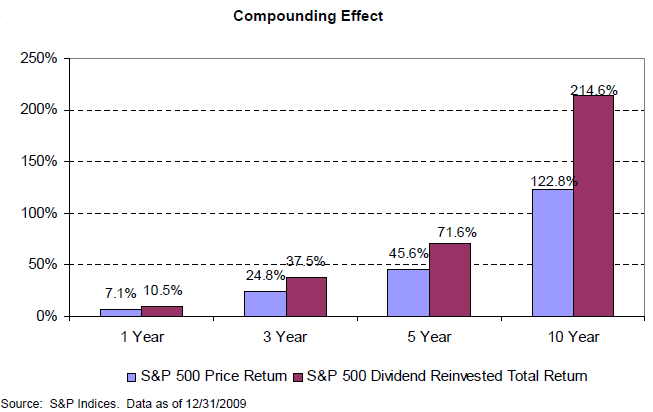
An important factor for investors to consider is to establish an appropriate risk tolerance and time horizon for their investments as the stronger returns can occur later in the decade. The second slide in the below report displays the 10-year rolling returns for the S&P 500 Index since the 1930s.
Posted by
David Templeton, CFA
at
3:23 PM
0
comments
Labels: General Market
Thursday, January 21, 2010
Comprehensive Review Of The Dividend Aristocrats
An important factor to review in selecting dividend growth stocks is S&P's Quality Ranking. Standard & Poor's states:
The ability of management to maintain stable or increasing dividends indicate the quality of the firm’s earnings and its growth prospects. The S&P Common Stock Ranking systems, for over 40 years, ranks stocks in categories based on growth and stability of earnings and dividends. [The below chart shows] ...the distribution of quality ranks of the constituents of the S&P 500 Dividend Aristocrats against those of the S&P 500 Index.
Source:
S&P 500 Dividend Aristocrats
Standard & Poor's
By: Aye M. Soe and Dave Guarino
PDF via .docstoc
Posted by
David Templeton, CFA
at
10:50 PM
0
comments
Labels: Dividend Analysis
Wednesday, January 20, 2010
S&P 500 Sector Earnings Growth For 2010
Posted by
David Templeton, CFA
at
10:49 PM
0
comments
Labels: General Market
Monday, January 18, 2010
Sentiment, Earnings and Asset Allocation: Making Sense Of The Data
The individual sentiment data reported last week by the American Association of Individual Investors shows bullish investor sentiment rose over six percentage points to 47.4% from last week's bullish sentiment reading of 41%. This reading is below the average plus one standard deviation of the bullish sentiment reading. The 8-period moving average of the bullish sentiment reading increased to 43% from 42% last week. At the market top near the beginning of 2000, the 8-period average was in the high 50's and even hit 60 at one point. In short, sentiment is elevated, but does not seem to be at an "extreme" level yet.
- how likely is the financial sector to incrementally grow 2010 earnings by $8 per share on average, and
- how will Washington policies: cap and trade, health care, etc., impact company earnings
Much is made of the benefit of running deficits during economic slow periods. In 1937, the Roosevelt administration and the Federal Reserve reversed liquidity measures taken to fight the Depression. This is thought to have resulted in the double dip during that time period in addition to some other factors that were not pro-business (see my post, Positive Equity Market Returns Probable In 2010). The key though is how is the deficit money being spent. The deficit funds need to be spent in productive ways that create an environment that put the jobless back to work in the private sector and not the government sector.
In summary, sentiment and allocation data appear elevated but not at extremes. At the same time the market's forward valuation does not appear too stretched. This does not mean dive head first into the market. Being selective in the companies one invest in could still provide adequate returns in 2010, but not without experiencing some volatility.
Posted by
David Templeton, CFA
at
12:59 PM
0
comments
Labels: Economy , General Market , Sentiment , Technicals
Sunday, January 17, 2010
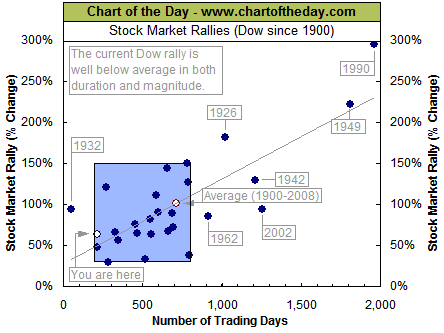
Current Dow Rally Below Average In Magnitude And Duration
- most major rallies (73%) resulted in a gain of between 30% and 150% and lasted between 200 and 800 trading days.
- the current Dow rally (hollow blue dot labeled you are here) has entered the low range of a "typical" rally and would currently be classified as both short in duration and below average in magnitude.
If company earnings reports meet or exceed expectations on the whole this reporting period, the market could continue to grind higher.
Posted by
David Templeton, CFA
at
5:48 PM
0
comments
Labels: General Market , Technicals
Saturday, January 16, 2010
Positive Equity Market Returns Probable In 2010
If the market is similar to the 1937-1942 period, investors might want to be cognizant of policies that impacted the market and economy during the '37-'42 time period. I must say I am not in agreement with some of the author's conclusions in the article at the previous link (like continued deficit spending). What is important for investors is to understand the policies that were instituted at that time that may have prolonged the recession during that period--like the Wagner Act. Some of the policies out of Washington today look similar and could derail the recovery past 2010.
Posted by
David Templeton, CFA
at
7:50 PM
0
comments
Labels: Economy , General Market , Technicals
Thursday, January 14, 2010
Highest Yielding Stocks In The S&P 500 Index Best In The Long Run
"If an investor had put $1,000 in a portfolio of the 100 highest-yielding stocks on January 1, 1957, by December 1, 2009, he would have accumulated more than $450,000 (assuming all dividends were reinvested). That’s a hefty annualized return of 12.5%, an average of almost 2.5 percentage points per year greater than the return on the S&P index. That same $1,000 invested in the 100 lowest-yielding stocks returned only 8.8% per year."
- for 2007, at the height of the bull market, the dividend stream -- total dividends paid on all U.S. stocks -- was $288 billion.
- for 2009 through November, the dividend stream had dropped to $216 billion -- the greatest decline in that measure since the end of World War II
- the entire decline in dividends can be attributed to the financial sector, which cut its total payouts by $79 billion over the past two years. (Siegel includes General Electric because GE’s dividend reduction was caused solely by the losses at GE Capital.)
- in other sectors of the economy -- energy, health care, technology, consumer discretionary, consumer staples, telecom -- dividends have actually risen over the past two years, even with the recession.
Source:
Scoop Up Dividends
Kiplinger Magazine
By: Jeremy Siegel
February, 2010
http://www.kiplinger.com/columns/goinglong/archives/scoop-up-dividends.html
Posted by
David Templeton, CFA
at
11:01 PM
0
comments
Labels: Dividend Return
Linear Technology: Buy The Rumor Sell The News
In the company's earnings release, they also announced a 4.5% increase in the quarterly dividend to 23 cents per share versus 22 cents per share in the same period last year. The company has increased its dividend each year since it first began paying one in 1992. The projected payout ratio using an average of the June 2010 year end earnings estimate ($1.24) and the June 2011 earnings estimate ($1.51) is 67%. The payout ratio trend continues to move higher with the 5-year average payout ratio equaling about 43%. The company does maintain an S&P Earnings & Dividend Quality Ranking of A-.
Posted by
David Templeton, CFA
at
12:09 AM
0
comments
Labels: Dividend Analysis
Sunday, January 10, 2010
Investor Sentiment Near Long Term Average
Posted by
David Templeton, CFA
at
11:16 PM
0
comments
Labels: Sentiment
Essentially No Job Growth In Last Decade
Posted by
David Templeton, CFA
at
11:44 AM
0
comments
Labels: Economy
Friday, January 08, 2010
Washington's Policies On Jobs Misguided
Today's jobs report noted companies shed 85,000 jobs in December versus consensus expectations of a 10,000 job loss figure. Additionally, the work force declined 661,000 showing the jobless are giving up. When discouraged workers and part-time workers who would prefer full-time jobs are included, the so-called "underemployment" rate in December rose to 17.3% from 17.2% in November. This is near the record high reported in October of 17.4%.
As reported by ABC News, the administration's response to these job numbers was the implementation of a green jobs program.
"Obama announced the awarding of $2.3 billion in tax credits to companies that manufacture wind turbines, solar panels, cutting edge batteries and other green technologies. The money will come from last year's $787 billion stimulus program. He also renewed a call by Vice President Al Gore for Congress to approve an additional $5 billion to help create more such jobs."
According to the Cybercast News Service, it is noted,"Spain’s experience (cited by President Obama as a model) reveals with high confidence, by two different methods, that the U.S. should expect a loss of at least 2.2 jobs on average, or about 9 jobs lost for every 4 created, to which we have to add those jobs that non-subsidized investments with the same resources would have created,” wrote Calzada in his report: Study of the Effects on Employment of Public Aid to Renewable Energy Sources"
"in the study’s introduction Calzada argues that the renewable jobs program hindered, rather than helped, Spain’s attempts to emerge from its recession."
“The study’s results show how such 'green jobs' policy clearly hinders Spain’s way out of the current economic crisis, even while U.S. politicians insist that rushing into such a scheme will ease their own emergence from the turmoil,” says Calzada. “This study marks the very first time a critical analysis of the actual performance and impact has been made."
Pat Michaels, professor of environmental sciences at the University of Virginia and senior fellow in environmental studies at the Cato Institute, a free market group, told CNSNews.com that the study’s conclusions do not surprise him. He added that the United States should expect similar results with the stimulus money it spends on green initiatives.
Michaels also said he was not surprised by the study’s finding that only one out of 10 jobs were permanent.
and Here comes another multi-billion-dollar Green Jobs boondoggle
Posted by
David Templeton, CFA
at
5:41 PM
0
comments
Labels: Economy
Thursday, January 07, 2010
Dividend Actions Largely Negative In 2009, Dividend Growth To Resume In 2010
- 804 companies cut their dividend payments in 2009 which was a 631% increase over the 110 companies that cut their dividends in 2007.
- In absolute dollars, the cuts represented $58 billion in reduced dividend income.
The current top payers (over $5 billion) are:
- AT&T ($9.9 billion rate)
- Exxon ($8.0 billion)
- Pfizer ($5.8 billion)
- Chevron ($5.5 billion)
- Johnson & Johnson ($5.4 billion)
- Verizon ($5.4 billion)
- Procter & Gamble ($5.1 billion)
Source:
2009 Worst Year Ever For Dividends;
Expects 2010 to Show Steady Improvement
Standard & Poor's
By: Howard Silverblatt
January 7, 2009
http://www.businessweek.com/investing/insights/blog/Worst_year_for_dividends_2009.doc
Posted by
David Templeton, CFA
at
11:24 PM
1
comments
Labels: Dividend Return
Tuesday, January 05, 2010
Easy Money Was Made In 2009
- 425 issues were up with an average return of 51.4%
- 73 issues were down with an average return of -14.3%.
Posted by
David Templeton, CFA
at
7:27 PM
0
comments
Labels: General Market
Dividend Payers Underperformed In 2009
Posted by
David Templeton, CFA
at
6:21 AM
0
comments
Labels: Dividend Return
Saturday, January 02, 2010
Mid Term Election Year Market Returns
Posted by
David Templeton, CFA
at
12:14 PM
0
comments
Labels: General Market , Technicals
Friday, January 01, 2010
Dividend Payers With Below Market Valuation
Below is a list of 26 companies in the S&P 500 Index that was generated using the following criteria:
- current P/E less than 15
- dividend yield greater than 2.5%
- beta less than .7
Posted by
David Templeton, CFA
at
7:02 PM
0
comments
Labels: Investments , Valuation
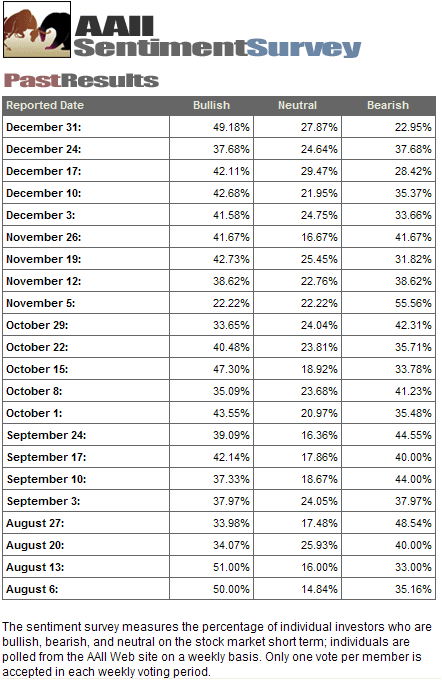
Investor Sentiment Suggesting Caution
- bullish investor sentiment is reported at 49.18% this week. This is the highest level since 51% was reported on August 13, 2009.
- bearish sentiment is reported at 22.95% and is the lowest bearishness reading since 22.31% on February 27, 2007.
- the bull/bear spread is reported at 26% and is the widest spread since 28% was reported on May 8, 2008.
Posted by
David Templeton, CFA
at
1:16 PM
0
comments
Labels: General Market , Sentiment
Thursday, December 31, 2009
Markets And Their 200 Day Moving Average
Disclosure: Long Procter & Gamble
Posted by
David Templeton, CFA
at
3:46 PM
1
comments
Labels: General Market
Wednesday, December 30, 2009
Unsustainable Growth In Government Debt
Posted by
David Templeton, CFA
at
7:48 PM
2
comments
Labels: Economy
Monday, December 28, 2009
Book Review: Why Are We So Clueless About The Stock Market?
I believe this book is best suited for new, or somewhat new, investors in the stock market. Mariusz does a nice job leading his readers from the beginning or inception of a stock, a company's capital structure and through the time one should consider selling a stock. The book includes a chapter on the economy including a brief discussion on the economic cycle. Mariusz's investment style seems more of a contrarian or value one. He rhetorically ask a couple of questions,
- "When is it best to own a great company--in good times or bad times?"
- "When is one more likely to buy a great company at a reasonable price--in good times or bad times?"
Buying stocks is not too different from buying real estate. That is, one makes money in real estate not when they sell it, but when they buy it. In other words, what one makes is based on how much they paid for it. Real estate investors have been finding that out over the last year to year and a half. So I digressed.
The book covers topics on valuing stocks based on the dividend discount model. Additionally, he shows how company leverage can add value to a company's earnings. He shows how the value that is created (or not created) is based on the financing cost and the company's return on equity or ROE. In the chapter on "Basic Capital Structure" he provides investors with a way to evaluate a company's earnings growth and whether reinvested earnings are being reinvested "efficiently" as he states.
And finally, beyond the financial numbers, he discusses what comprises a good business. Does the company have a "wide moat" around its products and market. If so, this type of company tends to have higher ROEs and thus potentially higher sustainable returns.
At the end of the book Mariusz provides several case studies or real examples that utilize the topics he covers in his book in order to evaluate specific companies.
In conclusion, I found the book an easy read that was not mired in technical details. Having said this, Mariusz provides his readers with spreadsheets useful in valuing a company's stock. Additionally, I do believe this book will provide its readers with a good starting foundation upon which to build their investment knowledge.
Posted by
David Templeton, CFA
at
11:19 PM
0
comments
Labels: Book Review
Thursday, December 24, 2009
Top Economist Ed Hyman's And Francois Trahan's 2010 Forecast
- 2009 was the year of the beta trade. In 2010 the focus will be on companies that generate free cash flow and pay dividends.
- anticipate upside surprise for companies with exposure to southeast Asia economies.
- Francois believes a contrarian view could be rates actually fall in 2010. On a percentage basis, interest rates have risen as much as the equity markets have moved higher.
Posted by
David Templeton, CFA
at
3:47 PM
0
comments
Labels: Economy , General Market
Wednesday, December 23, 2009
If Investing Based On Yield, Know What Makes Up The Yield
As noted in yesterday's post, Blackrock's Dividend Achievers Trust (BDV) distributes a payout every quarter. This quarterly payout includes more than the income from the underlying investments. This type of payment is often referred to as a managed distribution. Many online sources include the entire distributions amount in the yield calculation. Some of the distribution can be a return of an investor's capital.
Investors can get a list of closed end funds that make payouts that are in excess of the income generated by the underlying investments at the Closed End Fund Association's (CEFA) website. The CEFA lists some forty CE funds that have manged distributions. For reference, these distributions are know as Section 19 payments.
Several years ago, the Gabelli Funds prepared a paper on the pros and cons of managed distributions. The paper can be read below.
Closed End Funds Managed Distribution Policy: What Is It?
Posted by
David Templeton, CFA
at
12:12 AM
0
comments
Labels: Dividend Return , Investments
Monday, December 21, 2009
Jim Cramer Does Not Disclose Complete Picture On Blackrock's Dividend Achievers Trust Yield
Some investments distribute both principal (an investor's capital) and income to its investor on a regular basis. For Blackrock's Dividend Achievers Trust, the "income yield" is only 3.46% and the "distribution yield" is 7.67% as of November 30, 2009. The difference between the two yields is the return of an investor's investment in the fund so should it really be counted as income? Personally, I don't think so. Below is a table taken from Blackrock's Section 19 Notice for the Dividend Achievers Fund.
"The last challenge that I would like to discuss with you today involves disclosures associated with a fund's yield or its managed distribution plan. Closed-end funds sometimes tout a high, level dividend or a managed distribution plan to investors. Investors may incorrectly believe that the dividend rate is "yield," i.e., earned income or gain. In fact, the dividend rate often includes a return of capital (emphasis added). As directors, you must make sure that the fund's disclosures explain what the distribution yield represents and what it does not represent and that it is not confused with the fund's actual performance. In particular, if a fund with a managed distribution plan does not earn enough income to sustain a distribution, it must be clear that distributions to investors may be paid from a return of capital which has the effect of depleting the fund's assets. Moreover, in exercising your oversight, you should carefully consider whether managed distribution plans continue to be in the best interests of the fund and its shareholders.
Let me highlight one additional managed distribution plan disclosure issue for your consideration. As you know, funds are required under Rule 19a-1 to provide notice when distributions include a return of capital. In reviewing these notices, my staff has found inconsistencies between 19a-1 notices and other information posted on a fund's website. In particular, the 19a-1 notices show the return of capital while other charts on a fund's website show distributions consisting of all income. Funds have indicated to us that the reason for any differences is because the disclosures are prepared under different bases with 19a-1 notices disclosing book values and other disclosures based on tax considerations. However, fund websites do not always include an explanation discussing why the information is inconsistent in different online sections. Accordingly, I suggest that you review your fund's disclosures to make sure that the information is disclosed consistently and, if not, that the reason or reasons for any inconsistencies are adequately explained to investors."
Posted by
David Templeton, CFA
at
9:23 PM
1
comments
Labels: Dividend Return , Investments
Sunday, December 20, 2009
BetterInvestings Most Active As Of December 20, 2009
Posted by
David Templeton, CFA
at
1:17 PM
0
comments
Labels: Investments
Thursday, December 17, 2009
Pimco Increasing Cash Position
Source:
Pimco’s Gross Boosts Cash to Most Since Lehman Failed
Bloomberg
By: Wes Goodman and Garfield Reynolds
December 17, 2009
http://www.bloomberg.com/apps/news?pid=20601087&sid=aQYnPNqVNIsg&pos=2
Posted by
David Templeton, CFA
at
9:11 PM
0
comments
Labels: General Market
Bullish Investor Sentiment Stuck In A Range
As this indicator is a contrarian one, bullishness readings in the high 40% area would be a reason for equity investor to become more cautious based on this indicator if viewed in a vacuum. Interestingly, this week's bearishness level fell to 28.42% versus the prior week's bearishness level of 35.37%. Consequently, the bull/bear spread widened to +14% versus last week's spread of +7%.
Posted by
David Templeton, CFA
at
8:59 PM
0
comments
Labels: Sentiment
Wednesday, December 16, 2009
A List of Dividend Growers In The S&P 1500 Index
This list includes large, mid and small capitalization dividend growers. S&P appropriately notes that the below list of stocks are not necessarily buy candidates, but a starting point for additional research.
Posted by
David Templeton, CFA
at
11:06 PM
0
comments
Labels: Dividend Analysis
Tuesday, December 15, 2009
Stock Buybacks On The Rise
This increased buyback activity coincides with an improvement in "as reported" earnings. The low point in earnings came in the fourth quarter last year when earnings, or lack there of, were reported at -$202.11 billion. In the third quarter of 2009 the final tally for as reported earnings are projected to total $131.96 billion, the third straight quarterly improvement.
Source:
S&P 500 Buybacks Rebound 44%; Remain 80% off Their High (pdf)
Standard & Poor's
By: David Guarino and Howard Silverblatt
December 14, 2009
Posted by
David Templeton, CFA
at
10:00 PM
0
comments
Labels: Dividend Analysis
Sunday, December 13, 2009
Dividend Aristocrats For 2010
Source: Standard & Poor's (xls)
Posted by
David Templeton, CFA
at
8:27 PM
0
comments
Labels: Dividend Analysis
Saturday, December 12, 2009
Government Spending Is Out of Control
Since this crisis began in late 2008, the government has spent $4 trillion supporting various new programs. The government has committed to spend an additional $7.8 trillion over the next several years which will bring the total new spending amount to $12 trillion. As year-end approaches, Congress wants to increase the U.S. debt limit by nearly $2 trillion. The spending coming out of Washington does need to stop.
How does this spending compare to spending in past crises?
- Marshall Plan-$115 billion
- New Deal-$500 billion
- TARP-$700 billion
- Stimulus Plan-$787 billion
- World War II-$3.6 trillion
As Margaret Thatcher once said, "the problem with socialism is that you eventually run out of other people's money." I think we could be on a slippery slope to that outcome if the government does not reign in its current rate of spending growth.
Posted by
David Templeton, CFA
at
6:08 PM
1
comments
Labels: Economy
Key Economic Indicators Suggest The Worst Is Behind Us
The three indicators that are in an improving trend are:
- Jobless Claims
- Retail Sales
- Interest Rate Spread (the TED spread)
- Durable Goods Orders
- Existing home Sales
- Consumer Confidence
- Look for a four-week moving average hitting 550,000 and continuing to decline would signal that companies have stopped slashing jobs. The four week moving average is 473,750.
Durable Goods Orders
- A two- or three-month uptrend in orders -- excluding defense, aircraft and other transportation equipment -- would presage an expanding economy. New orders for manufactured durable goods in October decreased $1.0 billion or 0.6 percent to $166.2 billion according to the latest U.S. Census Bureau report. This was the second monthly decrease in the last three months. This followed a 2.0 percent September increase. Consequently, this indicator's trend falls short of meeting an uptrend requirement.
- Two to three straight months of increasing sales would mean consumers have more money in their pockets and are willing to spend it. Each of the last two months have seen higher retail sales. Sales have increased from $343.7 billion in September to $352.1 billion in November.
- Two or three consecutive months of growth would be a sign that investors and would-be homeowners are back in the market. Although existing home sales are not showing sequential 2 or 3 months of growth, since May, sales in 2009 have exceeded the monthly sales of the same period in 2008.
Consumer Confidence
- An index in the 60s would suggest that consumers will be less tightfisted. The November Index was reported at 49.5 versus the prior months index reading of 48.7. According to the Conference Board, "the moderate improvement in the short-term outlook was the result of a decrease in the percent of consumers expecting business and labor market conditions to worsen, as opposed to an increase in the percent of consumers expecting conditions to improve. Income expectations remain very pessimistic and consumers are entering the holiday season in a very frugal mood."
Interest Rate Spread
- A narrowing of the gap to about one-half of a percentage point would signal improving health in the banking sector. The spread has remained below 50 basis points for the last six months.
Posted by
David Templeton, CFA
at
4:50 PM
1
comments
Labels: Economy , General Market
Monday, December 07, 2009
S&P 500 Dividend Estimate Down 21.4% In 2009, But Growth Likely Resumes In 2010
As the below chart notes, as reported operating earnings are estimated to have returned to growth in 2009. This improved earnings outlook as pushed down the payout ratio (based on operating earnings) for 2009.
"While we do expect additional dividend decreases, Standard & Poor’s believes that improving economic conditions will inspire companies to slowly increase their payouts," notes Howard Silverblatt, Senior Index Analyst at S&P Indices. "We expect dividend rate increases to average in the mid to high single digits, with the second half of the year much better than the first half as companies will need time to reassure themselves of their product and financial position."
Source:
S&P Estimates 6.1% Dividend Increase for the S&P 500 Companies in 2010;
2009 Dividend Payment Expected to Post 21.4% Decline
Standard & Poor's
By: David Guarino and Howard Silverblatt
December 7, 2009
Posted by
David Templeton, CFA
at
10:28 PM
0
comments
Labels: Dividend Analysis
Sunday, December 06, 2009
Big Changes For Dividend Aristocrats Index in 2010
The S&P 500 Dividend Aristocrats Index is designed to measure the performance of S&P 500 constituents that have followed a managed-dividends policy of consistently increasing dividends every year for at least 25 years. The index is equal-weighted, with constituents being re-weighted every quarter. Membership is reviewed each December.
The following ten companies will be removed from the Aristocrats list:
- Avery Dennison (AVY)
- BB&T Corp (BBT)
- Gannett (GCI)
- General Electric (GE)
- Johnson Controls (JCI)
- Legg Mason (LM)
- M&T Bank (MTB)
- Pfizer (PFE)
- State Street (STT)
- US Bancorp (USB)
Source: Standard & Poor's
Posted by
David Templeton, CFA
at
5:27 PM
1
comments
Labels: Dividend Analysis , Dividend Return
Thursday, December 03, 2009
Ecolab Increases Dividend 10.7%
Posted by
David Templeton, CFA
at
7:39 PM
0
comments
Labels: Dividend Analysis
Wednesday, December 02, 2009
Nucor Increases Dividend 37th Consecutive Year
The company is projected to report a loss of 85 cents per share for 2009 but 2010 estimates have the company earning $2.79 per share. The payout ratio is estimated to equal 52% based on 2010 earnings. The company's 5-year average payout ratio (excluding 2009) is 9%. Nucor as an S&P Earnings & Dividend Quality Ranking of B.
As noted in Nucor's press release:
"Nucor has increased its regular, or base, dividend for 37 consecutive years -- every year since it first began paying dividends in 1973. Reflecting the Nucor team's success in building Nucor's long-term earnings power, the base quarterly dividend has more than tripled since the end of 2007. In addition, over the period from 2000 to 2009, Nucor's base dividend has increased approximately ten-fold."
(Disclosure: long interest in NUE)
Posted by
David Templeton, CFA
at
9:16 PM
0
comments
Labels: Dividend Analysis
Tuesday, December 01, 2009
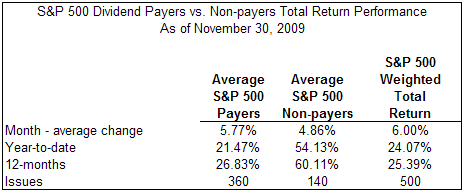
Dividend Payers Outperform Non Payers In November
Posted by
David Templeton, CFA
at
8:29 PM
0
comments
Labels: Dividend Return