 |
| From The Blog of HORAN Capital Advisors |
 |
| From The Blog of HORAN Capital Advisors |
 |
| From The Blog of HORAN Capital Advisors |
 |
| From The Blog of HORAN Capital Advisors |
Posted by
David Templeton, CFA
at
8:58 PM
0
comments
![]()
![]()
Labels: General Market
 |
| From The Blog of HORAN Capital Advisors |
Posted by
David Templeton, CFA
at
4:00 AM
0
comments
![]()
![]()
Labels: General Market
Posted by
David Templeton, CFA
at
3:28 PM
0
comments
![]()
![]()
Labels: Week Ahead
 |
| From The Blog of HORAN Capital Advisors |
 |
| From The Blog of HORAN Capital Advisors |
 |
| From The Blog of HORAN Capital Advisors |
"As the third-quarter earnings reporting season approaches, growth estimates have declined to a more modest 4.8%, down from the 8.5% projection from the beginning of the quarter... Looking ahead to the fourth quarter, the current estimate is for 11.1% earnings growth, which appears optimistic, given projections for only 1.3% revenue growth."
Posted by
David Templeton, CFA
at
11:55 PM
1
comments
![]()
![]()
Labels: Economy , General Market , Technicals
 |
| From The Blog of HORAN Capital Advisors |
Posted by
David Templeton, CFA
at
2:30 AM
0
comments
![]()
![]()
Labels: Dividend Analysis
Posted by
David Templeton, CFA
at
9:10 PM
0
comments
![]()
![]()
Labels: Economy
Posted by
David Templeton, CFA
at
8:37 AM
0
comments
![]()
![]()
Labels: Week Ahead
 |
| From The Blog of HORAN Capital Advisors |
 |
| From The Blog of HORAN Capital Advisors |
 |
| From The Blog of HORAN Capital Advisors |
 |
| From The Blog of HORAN Capital Advisors |
Posted by
David Templeton, CFA
at
11:00 AM
0
comments
![]()
![]()
Labels: Dividend Return , General Market
Posted by
David Templeton, CFA
at
9:19 AM
0
comments
![]()
![]()
Labels: Week Ahead
Posted by
David Templeton, CFA
at
2:06 PM
0
comments
![]()
![]()
Labels: General Market , International
 |
| From The Blog of HORAN Capital Advisors |
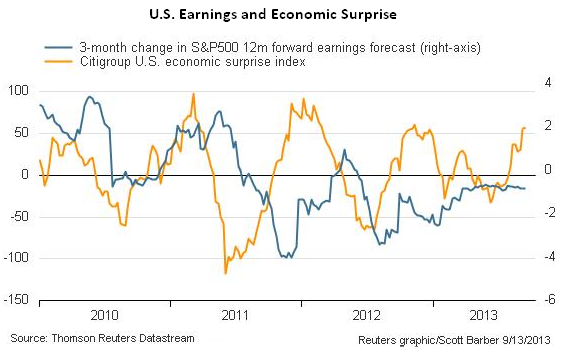
"The Citigroup Economic Surprise Indices are objective and quantitative measures of economic news. They are defined as weighted historical standard deviations of data surprises (actual releases vs Bloomberg survey median). A positive reading of the Economic Surprise Index suggests that economic releases have on balance [been] beating consensus. The indices are calculated daily in a rolling three-month window. The weights of economic indicators are derived from relative high-frequency spot FX impacts of 1 standard deviation data surprises. The indices also employ a time decay function to replicate the limited memory of markets."
 |
| From The Blog of HORAN Capital Advisors |
 |
| From The Blog of HORAN Capital Advisors |
Posted by
David Templeton, CFA
at
11:04 PM
0
comments
![]()
![]()
Labels: General Market , International
 |
| From The Blog of HORAN Capital Advisors |
Posted by
David Templeton, CFA
at
8:08 PM
0
comments
![]()
![]()
Labels: Sentiment
"The US real estate market continues to surge. For some perspective, today's top chart illustrates the US median price (adjusted for inflation) of a single-family home over the past 43 years while today's bottom chart presents the semi-annual percent change in home prices (also adjusted for inflation). Today's chart illustrates that the inflation-adjusted median home price has rarely increased more than 10% in six months (gray shading). When inflation-adjusted home prices did increase more than 10% in six months, it was often soon followed by a period of stagnant or declining prices. It is worth noting that over the past six months, the median price for a single-family home has shot up at the fastest pace on record."
 |
| From The Blog of HORAN Capital Advisors |
Posted by
David Templeton, CFA
at
4:17 PM
0
comments
![]()
![]()
Labels: Economy
 |
| From The Blog of HORAN Capital Advisors |
Posted by
David Templeton, CFA
at
10:58 PM
0
comments
![]()
![]()
Labels: Technicals
Posted by
David Templeton, CFA
at
9:11 AM
0
comments
![]()
![]()
Labels: Week Ahead
 |
| From The Blog of HORAN Capital Advisors |
 |
| From The Blog of HORAN Capital Advisors |
 |
| From The Blog of HORAN Capital Advisors |
 |
| From The Blog of HORAN Capital Advisors |
Posted by
David Templeton, CFA
at
11:14 AM
0
comments
![]()
![]()
Labels: Dividend Return , General Market
"The stock market has struggled over the past month. Investors are concerned. For some perspective, today's chart presents the Dow's average performance for each calendar month since 1950. As today's chart illustrates, it is not unusual for the stock market to underperform during the May to October time frame with a brief counter-trend rally occurring in July. It is worth noting that the worst calendar month for stock market performance (i.e. September) has just begun."
 |
| From The Blog of HORAN Capital Advisors |
Posted by
David Templeton, CFA
at
1:05 AM
0
comments
![]()
![]()
Labels: General Market , Technicals
 |
| From The Blog of HORAN Capital Advisors |
Posted by
David Templeton, CFA
at
11:14 AM
0
comments
![]()
![]()
Labels: General Market , Technicals
 |
| From The Blog of HORAN Capital Advisors |
 |
| From The Blog of HORAN Capital Advisors |
 |
| From The Blog of HORAN Capital Advisors |
Posted by
David Templeton, CFA
at
10:01 PM
0
comments
![]()
![]()
Labels: Economy
Posted by
David Templeton, CFA
at
10:57 AM
0
comments
![]()
![]()
Labels: Week Ahead