Tuesday, May 31, 2011

Food Inflation Versus CPI

Much has been made lately regarding food inflation and the lack of impact on the Consumer Price Index. In large part, the reason for this is due to the fact, in the U.S., the food component in CPI is a much smaller weighting than in developing countries around the globe.

From HORAN Capital Advisors

Below is a chart of the CRB Spot Foodstuffs Index and the U.S. Consumer Price Index. As the 20-year chart shows, although the Foodstuffs Index is up over 40% on a YOY basis and CPI is up 3.1%, the two indexes are tracking closely. Several of the component's of the Foodstuffs Index are butter, cocoa, corn and hogs. And, although we are seeing food price inflation, it represents a smaller weighting within the CPI, for example, butter is only .067% of the consumer price index.

From HORAN Capital Advisors


Sunday, May 22, 2011

Small Cap Valuations Getting Extended

On a relative basis, small cap stock stocks are trading at near record levels from a valuation perspective since 1990.

From HORAN Capital Advisors

A part of the valuation difference is a result of the strong performance achieved by small cap stocks versus large cap stocks. As the below chart details, the 10-year return of the Russel 2000 small cap index has far outpaced the return of the S&P 500 index, 70.8% versus 6.7%, respectively.

From The Blog of HORAN Capital Advisors


Friday, May 20, 2011

Bullish Investor Sentiment Continues Its Decline

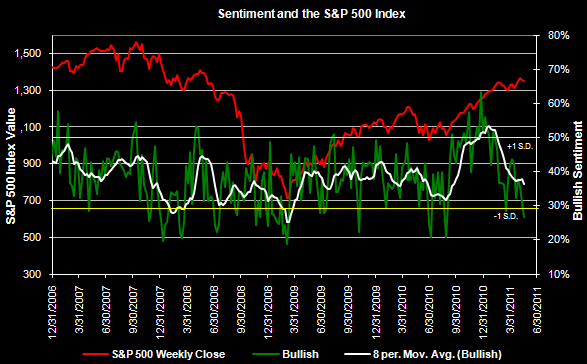
In this week's sentiment survey by the American Association of Individual Investors, it was reported that bullish sentiment fell to 26.69%. This is the lowest level for bullish investor sentiment since August of last year, which was near the low point for the market in 2010. The bull/bear spread was reported at -14.6%. It is important to note the sentiment indicator is a contrarian one and tends to be most accurate at its extremes. As the below chart outlines, the bullish indicator is entering extreme territory.

From HORAN Capital Advisors

Source: AAII


Tuesday, May 17, 2011

Why The Price Of A Gallon Of Gasoline Seems Elevated

A great deal of rhetoric is being expended on the fact consumers are paying high prices at the pump for a gallon of gasoline. Politicians are implying the oil companies are price gouging. Much of the attention is focused on the fact WTI (West Texas Intermediate) Cushing crude oil has fallen to around $97 per barrel. In September of 2008 when WTI was declining from its high of nearly $140 a bbl, a gallon of gas cost a consumer $3.70. The current price for a gallon of gas is around $4.00. So yes, pump prices do seem a little elevated on the surface. On the other hand, there is more at play than WTI crude prices.

From HORAN Capital Advisors

Since early this year, the price of Brent crude began to climb at a higher rate than WTI crude. At the moment, WTI is trading around $97 bbl and Brent is trading around $110. A week ago Brent was trading near $120 per bbl.

From HORAN Capital Advisors

The higher Brent price is largely due to the unrest in the Middle East. This unrest has placed a higher risk premium on crude prices that are exported and created more demand by European countries for Brent crude. Additionally, since the U.S. is a large importer of crude, gasoline pump prices are likely being set more off of the Brent price versus the WTI price.

Some in the media have indicated gasoline prices should be around $3.00 per gallon. However, in 2008, this was more the case when crude prices were rising than when they were falling. In a market driven economy, prices seem to always go up faster than they come down.

The disparity in price between WTI and Brent does not appear to be narrowing much at this point in time. Given the volatile situation in the Middle East, the price disparity could continue through the summer and higher than expected gasoline prices at the pump may be a fact of life near term.


Sunday, May 15, 2011

All The Economic News Is Not Bad

It seems much that is being written of late is focused on negative data points that attempt to rationalize why a correction is just around the corner. I get the sense the stock market's (Dow Jones Industrial Average) 30+% advance since early July is weighing on strategists' and investors' minds as not being sustainable. Certainly a pullback would be healthy for the markets.

Last week's investor sentiment survey from AAII certainly suggests the individual investor is not overly bullish. In fact, the bullish sentiment reading fell almost five percentage points to 30.77%. This is below the long term average of 39%.

From The Blog of HORAN Capital Advisors

In spite of the lack of enthusiasm of individual investors, and this is a bullish sign for the markets, the broader confidence and sentiment readings continue to improve. The consumer confidence index continues to trend higher along with the the University of Michigan Consumer Sentiment Index.

From The Blog of HORAN Capital Advisors
On the business front many of the data points suggest a continued improvement in the business segment of the economy.
  • Strength in industrial production.
From The Blog of HORAN Capital Advisors
  • improvement in nondefense manufacturers' new orders.
From The Blog of HORAN Capital Advisors
  • corporate profits are at record levels; however, after tax corporate profits recently turned lower.
From The Blog of HORAN Capital Advisors

From The Blog of HORAN Capital Advisors
  • business inventory to sales ratio continues to decline to a record low level. If sales continue to improve, this inventory will need to be replaced and will provide support to the production side of the economy.
From The Blog of HORAN Capital Advisors

Now that I have noted some positives on the economic front, there are certainly factors that could derail economic growth. I think Bill Gross' April investment outlook, titled Skunked, is a worthwhile read for all investors. The U.S. government has significant budget/structural issues that need to be dealt with by Congress. Any steps to reign in government spending will be contractionary from an economic perspective. The benefit of dealing with the deficit issue though could outweigh the short term negatives. In addition to the budget deficit, directly related is the upcoming end to the Fed's QE2 program.

Also, an article highlight from Abnormal Returns pointed to a report in The Economist that was suggestive of the global economy running out of steam. This recovery is certainly a fragile one, but it is a recovery nonetheless.

The equity and bond markets tend to be forward looking and from a pure technical perspective, Doug Short wrote about how many of the markets are currently testing key support levels. The market will get a chance to digest several important economic releases this week that deal with jobless claims and existing home sales. These support levels are worthwhile factors for investors to watch.

As Winston Churchill once said, "The pessimist sees difficulty in every opportunity. The optimist sees opportunity in every difficulty." There are certainly many factors around the globe that could derail our recovery. This does present investors with investment opportunities though.


Sunday, May 08, 2011

Dividend Actions As A Forecasting Variable

One reason we review a company's actions in regards to its dividends is these actions can provide insight into the potential direction of a company's stock price. Additionally, the broader dividend actions of companies in the S&P 500 Index can provide insight into the market's future direction as well. In as much as dividends are important, it is really the insight that dividends provide into a company's future cash flow expectations and the quality of its earnings.

The below chart graphs the S&P 500 Index returns for the seven year period (2003 - 2009). Admittedly, this is a short time period and I will attempt to post an analysis of the data over a longer time period in the near future. The graph also includes the positive dividend actions within the index lagged, or pulled forward 1-year. The correlation coefficient of the two data sets is .7775. This high level of correlation suggests that an investor's ability to forecast dividend actions can have a positive impact on ones investment returns.

From The Blog of HORAN Capital Advisors

We have written a number of articles on our blog that addresses the importance of dividends and the role they play in assessing the quality of a particular company's earnings.


Saturday, May 07, 2011

Positive Dividend Actions Now At 2006 Level

For the first four months of the year, positive dividend actions for companies in the S&P 500 Index equal levels achieved in 2006. The twelve initiated dividends this year are at their highest level during any point since 2004.

From The Blog of HORAN Capital Advisors

As the below table indicates, the sector contributing the largest percentage to the S&P 500's dividend income is now the consumer staples sector at just over 16%. In 2008, the financial sector was the largest contributor at more than 20%. Financials now account for 11.9% of the index's dividend income. Many investors and strategist seem to be counting on greater dividends from banking firms. This may materialize in the second half of 2011.


Data Source: Standard & Poor's


Thursday, May 05, 2011

Investor Sentiment Not Overly Bullish And The Presidential Election Cycle

This week's bullish investor sentiment level released by the American Association of Individual Investors came in at a not so bullish 35.46%. This is down from the prior week's bullishness level of 37.90%. The bull/bear spread narrowed to 3.6% versus 7.3% last week.

From The Blog of HORAN Capital Advisors
Source: AAII

The current week's bullishness reading is below the long term bullishness average of 39%. Investor should keep in mind that this one technical indicator is most accurate at extreme levels.

The strength of the market advance so far this year makes it not surprising that the market might experience a little consolidation. Also, for those interested in the presidential cycle, the third year of a president's term tends to be the best. The post I wrote on the presidential cycle in June of last year noted the strength of the market in Q4 of year 2, and in Q1 and Q2 of year 3. The average frequency of quarterly advances was over 80% in the three quarters noted previously.

From The Blog of HORAN Capital Advisors

From an economic perspective, recently released data points suggest a slow growth economic picture. Friday's non-farm payroll release could provide further confirmation of this slower growth view. At HORAN Capital Advisors, we continue to believe high quality large cap U.S. equities remain attractive in this environment and attractive from a valuation perspective. So outside the speculation in the commodity sector, the equity market's recent pullback is healthy and may afford investors an opportunity to build or add to equity positions.


Wednesday, May 04, 2011

Dividend Payers Outperform Non Payers In April

The return for the dividend paying stocks in the S&P 500 Index have trailed the return of the non payers in the index this year. However, in April the return for the dividend payers return narrowed this underperformance gap by outperforming the non payers, 3.21% versus 2.84%. Although one month does not make a trend, given the general seasonal weakness experienced in the market going into summer, maybe investors are beginning to favor the generally higher quality payers at this point in the market cycle.

From The Blog of HORAN Capital Advisors


Sunday, May 01, 2011

Strong Earnings Growth Supporting Market Advance

Strong earnings growth so far in the first quarter for companies in the S&P 500 Index is an important factor that explains the strength of the recent advance in the market. As the below chart shows, Q1 earnings expectations for S&P 500 companies has increased significantly.

From The Blog of HORAN Capital Advisors
  • The estimated growth rate for earnings in Q1 for S&P 500 companies is 18%.
  • The forward four quarter P/E ratio for the S&P 500 Index stands at 12.9.
  • Through the end of April, 324 companies have reported earnings, with 84% either exceeding or meeting expectations.
  • Companies are reporting earnings that are 7% above estimates which is greater than the 2% longer term average surprise factor.
Source: Thomson Reuters