When determining the future direction of the market, many investors and strategist turn to the price to earnings ratio. One key to using the P/E ratio is the calculation of earnings. Earnings are reported in several forms, one being "reported earnings" and the other referred to as "normalized" earnings. One significant point made in the article is the justification of using normalized earnings. Easterling notes,
"...if you only look at the P/E ratio reported for any quarter or year, the ratio during peaks and troughs will be quite distorted when compared to the more stable long-term average. About every five years or so, the reported P/E will reflect the opposite signal in contrast to a more rational view of P/E valuations. For example, the reported value for P/E in early 2003 reflected a fairly high value of 32 just as the S&P 500 Index had plunged to 800 (E had cycled to a trough of $25 per share). A P/E of 32 generally screams “sell” to most investment professionals; yet, in early 2003, that was a false signal! A more rational view using one of the business cycle-adjusted methods reflected a more modest 18. In a relatively low inflation and low interest rate environment, the scream should have been “Buy”…
Several years later, in 2006 (after an unusually-strong run in earnings growth), E peaked at $82 per share as the S&P 500 Index was hesitating at 1500. Most market pundits were recommending a strong “buy” due to a calculated P/E of only 17. Yet, using the rational business cycle-adjusted methodologies, the true message was “STOP”—P/Es were saying sell, with P/E more than 25.
Well the pundits were actually (sort of) right—P/Es did expand… Yet it was due to (what should have been expected) the normal down-cycle in E rather than the pundit-promoted increase in the stock market. So when investors’ stock market accounts were down almost 50%, they were handed explanations that the earnings decline was unexpected and the fault of the financial sector…
Many of the same pundits are bewildered by current market conditions and unsure about the future of E. The latest craze to extrapolate current conditions into the indefinite future has been named “The New Normal.” Slow economic growth, high saving rates, and unstable financial conditions—all fairly typical at the end of a recession—are now basic assumptions for years into the recovery expansion. Maybe this time will actually be different…or maybe not…
As for the market and P/E, it’s understandable that conservative investors and market spectators have watched the past six-month rally with awe. Yet the current P/E remains slightly undervalued and further gains are more likely; nonetheless, it is important to remain aware that typical market volatility makes it also likely that the market will experience significant short-term swings."
Ed Easterling of Crestmont Research provides an update on the market valuation in his quarterly P/E Report. The most recent report is detailed below and is a worthwhile reading. Beginning on page 4 of the report, he goes through his analysis of the potential target on the market (see Figure 6 on page 12.) Not that the market will go up in a straight line, but he does build a case for a 3-year target price on the S&P 500 Index of 1,685. The earnings figure utilized in the target is a normalized one that has been adjusted for inflation. A similar inflation adjusted valuation measure is used by Robert Shiller of Yale University.
The PE Report
The article's conclusion is the market remains in a secular bear market while still undervalued. As Crestmont has noted before, cyclical bull markets are common in longer term or secular bear market periods. Crestmont updates a table noting prior bear and bull market cylces.
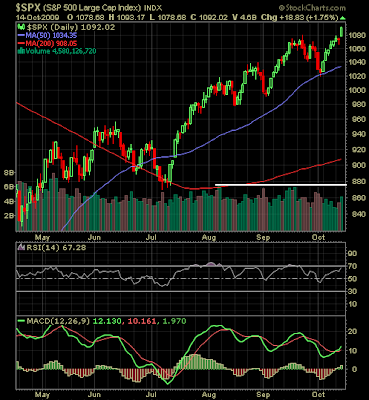
For investors, inflation is a critical variable that will impact the value of the market. Staying abreast of inflation data points will provide some insight into the markets future direction. The advance from the market's March low has been impressive. Today's move above 10,000 on the Dow and 1,090 on the S&P 500 index was important from a technical point of view. Interestingly, the volume today was better than what we have seen of late, which is good, but the volume level is not what one would see at capitulation buying points. This is only "one" technical factor, but it would suggest the market could still move higher as some investors are in disbelief that the market has not had a significant correction that would consolidate the gains since March.
For investors, inflation is a critical variable that will impact the value of the market. Staying abreast of inflation data points will provide some insight into the markets future direction. The advance from the market's March low has been impressive. Today's move above 10,000 on the Dow and 1,090 on the S&P 500 index was important from a technical point of view. Interestingly, the volume today was better than what we have seen of late, which is good, but the volume level is not what one would see at capitulation buying points. This is only "one" technical factor, but it would suggest the market could still move higher as some investors are in disbelief that the market has not had a significant correction that would consolidate the gains since March.
(click to enlarge)


No comments :
Post a Comment