Given the magnitude of the up moves and down moves in the stock market since 2000, many stock investors are now wondering what their investment approach should be going forward. Certainly evaluating ones risk tolerance at this point in the market cycle is appropriate. Assuming some level of equity exposure will remain a part of ones overall portfolio allocation, what type of market movement might investors expect going forward. Technical strategists are looking to the movement in gold (GLD) prices for insight, but note, I am not a gold bug.
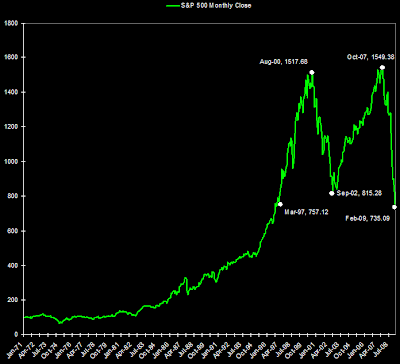
As the below chart of the monthly closing prices for the S&P 500 Index ($INX) notes, the index reached 1,517.68 in August 2000 and subsequently declined 46.2% to 815.28 in September 2002. The market had moved down over 20% before 9/11. The S&P then recovered to 1,549.38 over the next five years ending on October 2007. Since October 2007 the market has proceeded to decline over 50% to the February closing price of 735.09.
As the below chart of the monthly closing prices for the S&P 500 Index ($INX) notes, the index reached 1,517.68 in August 2000 and subsequently declined 46.2% to 815.28 in September 2002. The market had moved down over 20% before 9/11. The S&P then recovered to 1,549.38 over the next five years ending on October 2007. Since October 2007 the market has proceeded to decline over 50% to the February closing price of 735.09.
(click to enlarge)
 Since reaching 735 in February, the S&P 500 Index ($INX) has recovered some ground and closed at 806.25 today. This closing price is just below the September 2002 close of 815, which may serves as resistance for the market.
(click to enlarge)
 What investors need to keep in mind is we are still in a secular bear market. However, shorter term bull market moves can and do occur during these phases. One question then is how long will the bear market last.
The below table from Crestmont Research details bull and bear market cycles using the Dow Jones Industrial Average Index ($INDU) going back to 1901. Up until 1941, bull and bear market cycles tended to be shorter in nature, i.e., lasting four to five years on average. However, beginning in 1942 the market cycles lengthened quite dramatically--averaging about 19 years now.
Secular Bear Market Table
With these longer cycles, it became more common to have cyclical bull market phases within these secular downtrends. For example, in the 1966-1981 bear market the market achieved 9 positive returning years versus 7 negative returning years. The average return for the positive years was 13% and the average for the negative years was -15%. For the entire 16 year period, the market was down a cumulative 10%. One factor is certain and that is one can't predict when the end of this bear cycle will occur.
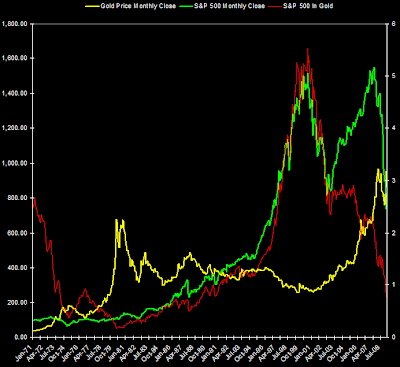
As noted earlier though, strategists are turning to gold for potential clues. An investor can think of this as someone making the decision to invest in paper assets (stock) versus hard assets (gold). The below chart shows the monthly closing price of the Dow Jones Industrial Average (green line) and the Dow Index divided by the price of gold (red line).
As noted earlier though, strategists are turning to gold for potential clues. An investor can think of this as someone making the decision to invest in paper assets (stock) versus hard assets (gold). The below chart shows the monthly closing price of the Dow Jones Industrial Average (green line) and the Dow Index divided by the price of gold (red line).
(click to enlarge)

Historically, the Dow Index has bottomed when the Dow/Gold ratio fell to 3 or lower. The ratio was about 7 when the market hit its recent low of 6,547 on March 9, 2009. The Dow Index is used most frequently since data on that index goes back to 1896 and the S&P 500 Index was first created in 1957. The chart of the S&P 500 Index priced in relation to gold is detailed below.
(click to enlarge)
 The chart moves seem dramatic so the below chart uses a logarithmic scale for gold and the S&P 500 Index. A log scale is essentially charting the same percentage moves. For example, the distance from 10 to 100 on the chart is the same as the distance from 100 to 1,000.
(click to enlarge)

A couple of takeaways from this information for investors.
- we are likely still in a bear market, but cyclical bull markets are not uncommon during this type of market so money can still be made on the long side.
- in reviewing the secular bull & bear market chart above, the stock valuations (P/E) at the end of bear markets tended to be around 10 or less. The current 10 year trailing P/E is 14. This market decline has reduced the valuation on a number of high quality stocks so investors may want to consider building positions in those type of equities.
- many investors have a desire to add bonds/fixed income to their portfolios. From an overall asset allocation perspective, fixed income can act as a shock absorber in down market periods. Interest rates are at record lows though and the fed is pumping money into the economy in hopes of stimulating future growth. This type of stimulus has tended to be inflationary. If growth and inflation take hold, the Fed will be quick to raise rates. In a rising rate environment, bond prices will fall. In that regard, below is a S&P/gold chart with the Fed Funds rate graphed as well. Given the potential for inflation, investors should consider looking at some type of inflation protected investments in their portfolio.
(click to enlarge)


No comments :
Post a Comment