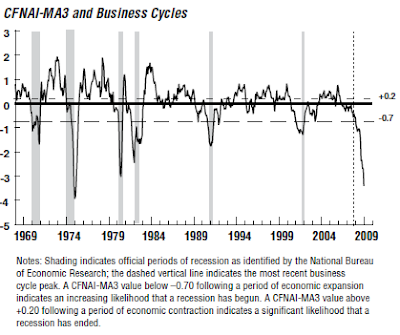
Although the Chicago Fed National Activity Index rose .20 points in January, the index remains below trend. The CFNAI came in at -3.45 versus -3.65 in December. The three-month moving average fell to -3.41, to its worst reading since February 1975, one month before that recession ended.
A longer term view of the CFNAI is detailed below:

What is the CFNAI?
The index is a weighted average of 85 indicators of national economic activity. The indicators are drawn from four broad categories of data:A zero value for the index indicates that the national economy is expanding at its historical trend rate of growth; negative values indicate below-average growth; and positive values indicate above-average growth.
- production and income,
- employment, unemployment, and hours,
- personal consumption and housing, and
- sales, orders, and inventories.
When the CFNAI-MA3 value moves below –0.70 following a period of economic expansion, there is an increasing likelihood that a recession has begun. When the CFNAI-MA3 value moves above +0.70 more than two years into an economic expansion, there is an increasing likelihood that a period of sustained increasing inflation has begun.


No comments :
Post a Comment