Wednesday, December 31, 2008

S&P 500 Index Approaching Breakout Level

In spite of the weak economic news, the S&P 500 Index has returned 20% since the November 20th low of 752. Today the index closed at 903.25 which is above its 50-day moving average of 887. A confirming uptrend can be achieved if the index breaks above 916.

From a technical perspective, a concerning aspect of the increase is the fact the uptrend has been occurring on increasingly lower volume. With the start of the new year just around the corner, increasing up volume and taking out the 916 level will be important technical factors to follow for the S&P 500 Index.

(click to enlarge)


Monday, December 29, 2008

A Perspective On The Fed's Recent Actions

On December 18th, Dallas Federal Reserve President Richard Fisher gave a speech before the World Affairs Council in Dallas. What is interesting about the speech is the insight it provides into the Fed's thinking regarding the recent interventions into the markets.

Additionally, history has a tendency to repeat itself and Mr. Fisher points to events that deepened the economic crises of 1873 and 1929. In both cases, country governments reverted to protectionist trade policies. The most common one many have heard of today is the passage of the Smoot–Hawley Act during the slowdown in 1930. This protectionist legislation deepened the economic contraction leading to the so called Great Depression. As Mr. Fisher states,
"As world economic growth slows and economic conditions in the United States toughen, our elected representatives and newly elected commander-in-chief must resist with every fiber of their political beings the temptation to compound our travails by embracing protectionism. For if they fail to do so, the economic situation we now are working so hard to overcome will seem like a cakewalk."


Sunday, December 28, 2008

Highest Yielding Stocks In The S&P 500 Index

A list of the ten highest dividend yielding stocks in the S&P 500 Index is detailed below. Currently, 371 of the S&P 500 companies pay a dividend and have an average yield of 3.9%. The overall yield for the index is 2.9%.

Source: indexArb


Friday, December 26, 2008

Evidence The Media Is A Contrary Indicator

Often times market strategists note the media's take on the market can be viewed as a contrary indicator. When the magazine covers finally note that investors should sell, the markets are generally down substantially. Conversely, when the television and print media note the markets are likely to move higher, the markets have already moved higher. From time to time I write about individual investor sentiment. Investors tend to become the least bullish at market bottoms and the most bullish at the top of a market.

An example of the media as a contrary indicator is noted at Todd Sullivan's ValuePlays website. Todd provides several video reviews of Jim Cramer's market calls and history will enable investors to judge the outcome of these calls.

In the end, investors need to remember that going against the crowd can generally be a positive factor to consider when committing money to the market or withdrawing money from the market. Sticking to a disciplined investing approach is crucial at market turning points.


Thursday, December 25, 2008

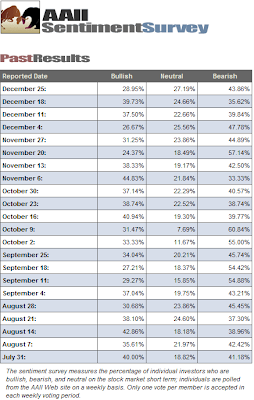
Steep Decline In Bullish Investor Sentiment

The American Association of Individual Investors' Sentiment Survey saw a decline in bullish investor sentiment of 10+ percentage points. The individual investor bullishness level was reported at 28.95%. This is down from 39.73% last week. The bull/bear spread widened to -14% versus +4% last week.

(click to enlarge)


Tuesday, December 23, 2008

S&P Announces 2009 Aristocrats

Standard & Poor's recently announced the companies that will comprise the Dividend Aristocrats for 2009. The S&P 500 Dividend Aristocrats are companies in the S&P 500 index that have followed a policy of consistently increasing dividends every year for at least 25 consecutive years. The 2009 Aristocrats total 52 companies for 2009 versus 60 companies for the 2008 Aristocrats. The list of 2009 Aristocrats is detailed below.


The new companies added to the Aristocrats list are:
  • Bemis (BMS)
  • Legg Mason (LM)
The companies that have been eliminated from the Aristocrat group are primarily centered in the financial sector. The companies eliminated are:
  • Anheuser Busch (BUD)-acquired
  • Bank of America (BAC)
  • Comerica (CMA)
  • Fifth Third Bancorp (FITB)
  • KeyCorp (KEY)
  • Nucor Corp. (NUE)
  • Progressive Corp. (PGR)
  • Regions Financial (RF)
  • Synovus (SNV)
  • Wm. Wrigley (WWY)-acquired
Source:

S&P 500 Dividend Aristocrats (PDF)
Standard & Poor's
By: Aye M. Soe & David Guarino
http://www2.standardandpoors.com/spf/pdf/index/SP500_Aristocrats_Paper_2008Dec.pdf


Sunday, December 21, 2008

What Is Wrong With The Economy And How To Fix It

The below video by Fred Thompson provides background on what got us into this economic situation and the government's response to get us back on firmer economic footing.


Wednesday, December 17, 2008

Tobin's "q" At 1965 Level

According to Argus Research Tobin's "q" has reached its lowest level since 1965. Argus notes:

"When the stock market trades at a 'discount' to the replacement cost of its assets, the market is inexpensive, or cheaper to buy than build. This discount possesses ‘q’ ratios that are less than 1.0. Conversely, when “q” exceeds 1.0, the market trades at a premium to its replacement cost. The runup from 1996-2000 had ‘q’ approaching the unthinkable value of 2.0...The long-term average for Tobin’s ‘q’ is 0.76."


Tobin's
I wrote an earlier post on Tobin's "q" in June that contains additional background information on this ratio.

Source:

Tobin’s ‘q’ at 0.76 in QIII ($)
Argus Research
December 17, 2008
http://www.argusresearch.com/


BB&T Corp. Increases Quarterly Dividend

BB&T Corp (BBT) announced a penny increase in the company's quarterly dividend. The new quarterly dividend increases to 47 cents per share versus 46 cents per share in the same quarter last year. It is encouraging to see the company come through with an increase, but the projected payout ratio is 74% based on 2009 estimated earnings per share of $2.52. The 2009 estimate is 12 cents lower than the 2008 EPS of $2.64. BBT carries a A- S&P Earnings & Dividend Quality Ranking.

(click to enlarge)

BB&T Corp. dividend analysis table December 16, 2008
BB&T Corp. stock chart December 16, 2008
Disclosure: I hold an interest in BB&T Corp.


Sunday, December 14, 2008

A Caution When Investing In Companies With High ROEs

(I orginally posted this article on The DIV-Net website.)

I have written a couple of articles in the past on on the benefits of reviewing a company's ROE or return on equity. One benefit of this measure is the resulting ROE calculation provides an investor with insight into management's use of capital. In general, higher ROE's point to better managed companies.

One danger looking solely at ROE is the ability of leverage (debt) to overstate ROE. In 2006, Bear Stearns' ROE was over 19% and this was an increase over the prior years ROE of 16%. What occurs is any debt taken on by a company reduces the equity figure. Since the ROE calculation is essentially net income divided by equity, a higher ROE would result for a company that uses debt versus equity to finance its operations. An example:

If you buy a house for $100,000 and borrow $50,000 to buy it, you have 50 percent debt and 50 percent equity in the home. Say the home is worth $110,000 a year later (this really is a hypothetical situation, isn’t it?). Your ROE is 20 percent: the $10,000 gain is divided by $50,000 in equity.

Now let’s say instead that you borrowed $75,000 to buy the home. The ROE would be 40 percent: $10,000 divided by $25,000 in equity. You’ve taken on more debt, but the results look more impressive.

Additionally, interest on debt (as compared to dividends) receives favorable tax treatment as well. The interest is deducted from a company's income before determining the level of taxes owed. On the other hand, dividends are paid out of net income and a company does not receive a tax deduction for the dividends that are paid. A company can enhance its ROE by using debt so long as the cost of the borrowing is less than the company's ROE.

Another way to calculate ROE is to use the DuPont Model. The DuPont Model formula is:

ROE = Net Profit Margin x Total Asset Turnover x Financial Leverage

  • Net Profit Margin = Net Income/Net Sales
  • Total Asset Turnover = Net Sales/Total Assets
  • Financial Leverage = Total Assets/Total Equity

The DuPont formula enables one to see more directly what is driving the increase in ROE.

As an investor analyzes a company and its ROE, it is important to know what is influencing the ratio. A high ROE in and of itself does not necessarily imply a strong management team or ongoing viability of the company.

Source: Checking for Bloated ROE ($)
BetterInvesting Magazine
By: Michael Maiello
January 2009
http://www.betterinvesting.org/Public/Store/Store/Membership/default.htm


Saturday, December 13, 2008

Dow Gold Ratio Suggests Nine Year Bear Market

An updated chart of the Dow/Gold ratio indicates the market continues in a 9-year bear market. According to Chart of the Day, "...it currently takes 10.5 ounces of gold to “buy the Dow.” This is considerably less that the 44.8 ounces it took back in 1999. When priced in gold, the US stock market has been in a bear market for the entire 21st century."


Thursday, December 11, 2008

Harsco And Valspar Increase Dividend

Both Harsco Corp. (HSC) and Valspar Corp. (VAL) announce increases in each company's quarterly dividend. Both company's are included in S&P's list of firms in the S&P 1500 that have increased their cash dividend payments for at least 10 years.

Valspar:
  • Quarterly dividend increases to 15 cents per share versus 14 cents per share in the same quarter last year.
  • The projected payout ratio is 38% based on estimated 2009 earnings per share of $1.58. The 5-year average payout ratio is approximately 30%.
  • The company maintains a B+ S&P Earnings & Dividend Quality Ranking.
Harsco Corp.:
  • Quarterly dividend increases to 20 cents per share versus 19.5 cents per share in the same quarter last year.
  • The projected payout ratio is 25% based on estimated 2009 earnings per share of $3.11. The 5-year average payout ratio is approximately 30%.The estimated 2009 earnings are down from expected 2008 earnings per share of $3.25.
  • The company maintains an S&P Earnings & Dividend Quality Ranking of A.
(click to enlarge)

Valspar and Harsco dividend analysis table December 2008
Valspar and Harsco stock chart December 2008


Wednesday, December 10, 2008

Stock Buybacks On The Decline

For the third quarter of 2009, stock buybacks for S&P 500 companies declined to $89.71 billion versus $171.95 billion in the third quarter of 2007. Dividends were actually slightly higher coming in at $61.44 billion versus $61.21 billion in the third quarter of 2007.

(click to enlarge)

S&P 500 stock buyback chart as of September 30, 2008Companies appear to be more cautious with their cash as buybacks and dividends decline or remain flat, respectively. In Wal-Mart's (WMT) November conference call (PDF), the company announced they were suspending their buyback program noting:
During the third quarter, we repurchased approximately $1.3 billion of our stock, which represents approximately 21.4 million shares. As we noted during the analyst meeting, we stepped back on share repurchases in early October. We believe it is more prudent to take a pause while the financial markets settle down (emphasis added). Year to date, we have purchased almost 61.5 million shares. Under our current $15 billion share repurchase authorization, we have spent almost $10 billion to repurchase approximately 203.6 million shares.
Howard Silverblatt, Senior index Analyst at Standard and Poor's noted in the S&P press release:
"Starting in the fourth quarter of last year, companies began to retreat from stock buybacks. Year-to-date, Standard & Poor’s data shows that stock buybacks are coming in at $156 billion less than this time last year."

"Cash levels for the third quarter of 2008 were near an all-time high, so it’s not that companies can’t fulfill buyback programs. They are instead choosing to hold onto the cash, unsure of what the near-term may bring."
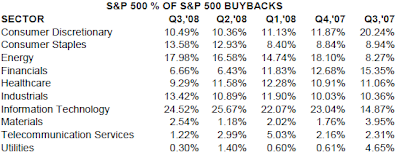
The below table details the buyback trend by S&P 500 sector going back to the third quarter of 2007.

(click to enlarge)

stock buyback by S&P 500 sector as of September 30, 2008

Data Source:

S&P 500 Stock Buybacks Continue At Lower Levels;
Retreat 48% in Third Quarter (PDF)

Standard & Poor's
By: Howard Silverblatt & David R. Guarino
December 10, 2008
http://www2.standardandpoors.com/portal/site/sp/en/us/page.article/2,3,2,2,1204842279743.html


Sunday, December 07, 2008

A Look At The Consumer

(I published a version of this article on The DIV-Net website on November 30, 2008)

The largest contributor to GDP growth in the U.S. is the consumer. The consumer accounts for nearly 70% of GDP and so goes the consumer so goes the U.S. economy. A reason for investors to keep tabs on consumer economic data is the data can provide a clue as to a potential turnaround in economic growth.

As the below chart notes, U.S. GDP has grown to over $14 trillion. At the same time, consumer debt has grown to over $14 trillion as well. The average level of consumer debt going back to 1953 is only 53%. The issue here is consumer debt has fueled a large part of the economic growth in the U.S. Since early 2007 though, consumer debt has begun to decline as a percentage of GDP.

(click to enlarge)


Consumers certainly need to live more within their means. However, with consumers finding more difficulty accessing the credit markets and continuing to reduce debt, what does this mean for the economy when it comes out of the recession?

Another economic variable investors can track to gain some perspective on the consumer is the Personal Consumption Index (PCE).

(click to enlarge)

Source: New York Times

The PCE measures the average price change for all domestic personal consumption. Updated data on the PCE Index can be found at the St. Louis Federal Reserve Bank economic data site.

So if consumer spending is potentially constrained in the next economic recovery cycle, it will be important for investors to invest in those firms that demonstrate they have the ability to grow earnings in the future. Evaluating the dividend practices of companies is one way to gain insight into a company's prospective earnings potential.


Saturday, December 06, 2008

Price Of Oil Versus Price Of Gasoline

Yesterday, WTI spot crude closed at $40.81 per barrel. By simply looking at pump prices, it is evident that gasoline prices of fallen dramatically along with crude. So how much lower could pump prices decline based on the per barrel price of crude?

(click to enlarge)


The above chart graphs oil prices along with gasoline prices. In January 2002, the per barrel price of crude was around $20 per barrel. At the same time, the average price of a gallon of gasoline was around $1.15 per gallon. Given the high correlation of pump prices to oil prices, it seems possible that near $1.00 per gallon of gasoline is a possibility. This decline in gasoline prices is equivalent to over $300 billion in tax cuts.


Thursday, December 04, 2008

Economic Conditions Not The Same As The Great Depression

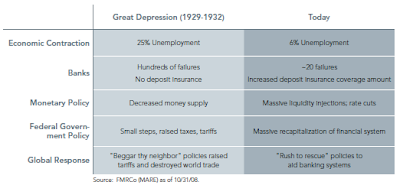
There are major difference between the current economic conditions and the government's response versus those that occurred during the Great Depression in 1929-1932. The below table details some of those differences.

(click to enlarge)

Depression versus 2008 economy tableDuring the early 30's depression, the government responded by decreasing the money supply and raising taxes and tariffs. It would be helpful if the incoming administration strongly stated it would not raise taxes and tariffs as were proposed during the presidential election campaign. The below charts show the government has done everything but reduce the money supply.

(click to enlarge)

The current bailout pledges now total over $8 trillion which is over 57% of GDP.

So what does all this mean for the future direction of the stock market? Liz Ann Sonders of Charles Schwab & Co noted in a recent report:
"Confidence will also come into play in the stock market—that ultimate mechanism of sentiment. Typically, stock markets bottom about 60% of the way through recessions. We've had 13 recessions since (and including) the Great Depression, 12 of which had accompanying bear markets or major corrections. Only once (2001–2002) did the market continue to sell off after the economy began to recover.

The fourth quarter of this year is likely to post the steepest decline in GDP during this cycle, with a drop of 5% or more in the cards. The worst single quarter ever for GDP was the fourth quarter of 1958, when it declined by a whopping 10.4%. The stock market had been weak heading into that quarter, but 18 months later it was up 52%—and a steady ascent at that. That's by no means a prediction of what we might look forward to, but is a reminder of the market's tendency to price in the worst case scenario before it unfolds, not after.

So, keep an eye on the stock market. Often when it begins to rally on still-bad news, it's a good sign for a pending economic recovery. However, be careful trying to pick a stock market bottom simply based on past recession-related performance."
There are several articles that contain additional analysis and graphics on the government's bailout.

Source:

Five Reasons Why Today Is Different From The Great Depression (PDF)
Market Analysis, Research and Education
By: Dirk Hofschire, CFA
November 25, 2008
http://eresearch.fidelity.com/eresearch/markets_sectors/economic.jhtml#

Recovery Watch 2009
Charles Schwab & Co.
By: Liz Ann Sonders, Chief Investment Strategist
December 2, 2008
http://www.schwab.com/public/schwab/research_strategies/market_insight/todays_market/recent_commentary/recovery_watch_2009.html


Tuesday, December 02, 2008

Dividend Deterioration

Dividend cuts for companies in the S&P 500 accelerated in November versus the same period last year. Standard & Poor's reports:
  • November cuts aggregate $4.89 billion.
  • The three month total stands at $20.85 billion and year to date the total is $38.0 billion.
  • S&P expects 4th quarter dividend payments to decline by 10%.
(click to enlarge)

dividend actions by month as of November 2008
Outside the S&P 500 Index, S&P indicates November was the worst month for dividends since 1956-the time at which the company began tracking dividend payments. Year to date, 55 companies have cut their dividend versus 11 in the same period last year.

With companies anticipated to experience a unfavorable economic environment in 2009, dividend investors are advised to evaluate a company's cash flow to judge the stability of the company's future dividend payments.

Source:

S&P 500 Market Attributes (PDF)
Standard & Poor's
By: Howard Silverblatt, Senior Index Analyst
November 2008
http://www2.standardandpoors.com/spf/pdf/index/2008_11_SP500.pdf


Monday, December 01, 2008

S&P 500: Dividend Payers Outperform Non-payers

The dividend payers in the S&P 500 Index have outperformed the non-payers on an average return basis in November, year to date and over the last 12-months as detailed in the below table. On a cap weighted basis though, the S&P 500 Index has outperformed both payers and non-payers.

(click to enlarge)

dividend payers versus non payers performance November 2008


Dividend Aristocrats That Have Cut Dividend

(I published a version of this article on The DIV-Net website on November 23, 2008)

As noted in my post from yesterday, the Dividend Aristocrats have performed well on a relative basis versus the S&P 500 Index and the Dow Jones Industrial Average. From a dividend perspective all the dividend cuts for the Aristocrats have been those companies in the financial sector. Detail on the recent dividend actions for the Aristocrats is contained in the below spreadsheet.