A lot has been said about the bulls needing to make a stand and push the S&P 500 Index above 1,420. Well this week the S&P did take out this resistance level and closed above 1,420 both Thursday and Friday. Next week the focus of the technical discussion might centered around the S&P 500 ability to hold and close above 1,420; thus creating a support level for the market. In the end though, I think this type of discussion is good; however, a long term investor should not get too focused on only technical data.
If an investor waited to put money to work until these support and resistance levels were validated, they would have missed a strong upward move in the market since the end of March as noted in the NYSE Index chart below.
If an investor waited to put money to work until these support and resistance levels were validated, they would have missed a strong upward move in the market since the end of March as noted in the NYSE Index chart below.
(click on chart for larger image)

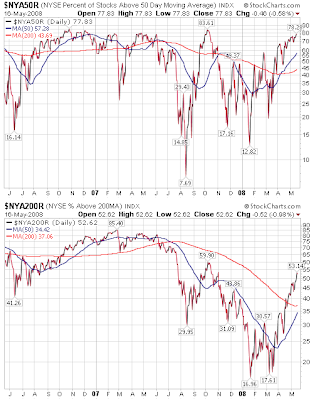
On a short term basis, a case could be made that the market needs to consolidate at this level before moving higher. The chart below shows that 78% of NYSE stocks are trading above their 50-day moving average. From a longer term perspective though, only 53% of NYSE stocks are trading above their 200-day moving average.
(click on chart for larger image)
 Beginning next week and going forward should be interesting for the market. From a short term perspective we could see some sideways market movement as some of the recent gains are digested. Longer term though, the market appears to want to go higher as it climbs the commodity "wall of worry."
No comments :
Post a Comment