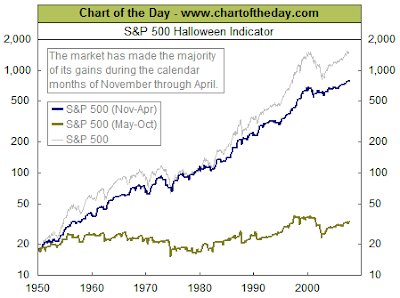
The Chart of the Day website has an interesting chart detailing the performance of the S&P 500 index from October 31st through the end of April. Since 1950 most of the gains achieved by the S&P 500 Index were generated in the November through April period. As Chart of the Day notes, "there are some noteworthy periods in which the Halloween indicator didn't produce (i.e. 1973-74 & 2000-01), the overall out performance is compelling."
(click on chart for larger image)


No comments :
Post a Comment