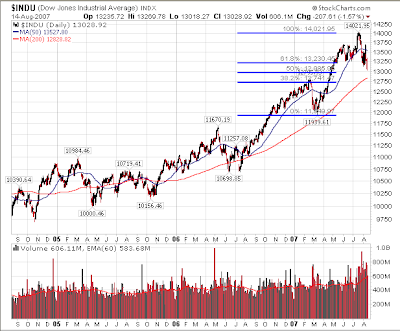
I am a firm believer that fundamentals of a stock or the market will be the determining factor in future performance. On the other hand, because enough market participants follow and trade on technical aspects of the market one must evaluate this type of data. Below is a chart of the Dow Jones Industrial Average with the Fibonacci Retracement lines overlaid on the chart.
- the 50% retracement stands at 12,985. Today the Dow closed at 13,028. This 50% retracement level may act as support for the market, all else being equal.
- the 38.2% retracement line is at Dow 12,741.
- a full retracement puts the Dow at 11,939.
(click on chart for larger image)

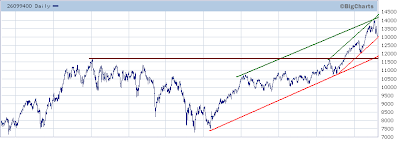
The ten year Dow chart does remain in an uptrend as noted in the trend line analysis below. However, this shorter term trend is near breaking support at the same level as the 50% Fibonacci Retracement line.
(click on chart for larger image)


No comments :
Post a Comment