Thursday, June 28, 2007

Bullish Sentiment Declines for Period Ending 6.27.2007

For the period ending June 27, 2007, the American Association of Individual Investors Sentiment Survey recorded a decline in bullish sentiment to 39.02%. This compares to last week's bullishness level of 43.16%.

As noted in the chart below, the purple line indicates the less volatile 8-period moving average of the bullish sentiment level as been declining since late 2003. In other words, the S&P 500 advance since that time has occurred as investors, on average, have been less bullish. Since the sentiment indicator is a contrarian one, it makes some sense that the markets has risen as the individual investor has become more cautious.

On the other hand, since the end of the first quarter in 2005, individual investors are increasingly becoming more bullish. The 8-period moving average increased to 39.0% in the period ending 6.27.2007 versus 37.7% for the 8-period average ending 6.20.2007. To me it does not appear we have experienced the speculative blow off rally with high investor bullishness. Is the time getting nearer though? It should be remembered this indicator is a volatile one and should not be used on a stand alone basis.

(click on chart for larger image)


Wednesday, June 27, 2007

Best Buy Increases Dividend By 62.5% On A Year Over Year Basis

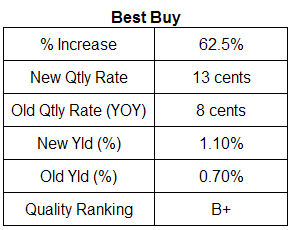
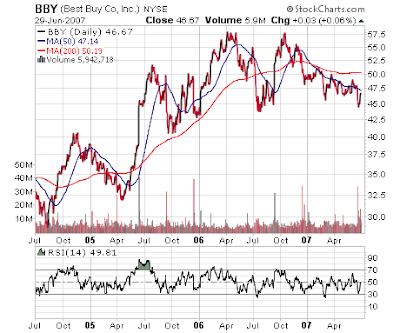
Today, Best Buy (BBY) announced a 62.5% increase in its quarterly dividend to 13 cents per share versus 8 cents per share in the same quarter last year. Additionally, the company announced a $5.5 billion stock buy back program. The estimated 2008 payout ratio is approximately 18% based on 2008 estimated earnings of $2.99.
(click on table/chart for larger image)

best buy dividend analysis. June 27, 2007 Best Buy Stock Chart. June 2007


Tuesday, June 26, 2007

Dow Jones Industrial Average: Updated Earnings & Dividend Data

Below is a table detailing updated earnings and dividend data for the 30 stocks that comprise the Dow Jones Industrial Average Index. The data is provided by Value Line in the recent weekly Selection & Opinion Report. On a complimentary basis, Value Line provides one page reseach reports for free at the Value Line website. The reports can be accessed by clicking this link.

(click on table for larger image)

Dow Jones Index date, earnings and dividends for the 30 Dow companies. June 29, 2007Source: Value Line Selection & Opinion Report, June 29, 2007


BB&T Corporation Increases Dividend 9.5%

BB&T Corporation (BBT) announced a 9.5% increase in the company's quarterly cash dividend today. The 5-year historical dividend growth rate for BBT is 8%. The new quarterly dividend of 46 cents per share is 4 cents higher than the comparable quarter dividend a year ago of 42 cents per share. The estimated payout ratio on 2007 estimated earnings of $3.34 is 55%.

(click on table/chart for larger image)

BB&T Corporation dividend analysis. June 26, 2007
BB&T Corporation stock chart. June 26, 2007


Duke Energy and Washington Federal Announce Dividend Increases

Today, Washington Federal (WFSL) announced a 2.4% increase in the company's quarterly dividend to 21 cents per share versus 20.5 cents per share in the same quarter last year. The estimated payout ratio based on 2007 estimated earnings of $1.56 is 54%. Historically, WFSL has a practice of paying a 10% stock dividend. However, these declarations generally occur in January and the company did not declare stock dividends in 2006 and 2007.

Duke Energy (DUK) also announced a dividend increase today of 4.8%. The quarterly dividend increases to 22 cents per share versus 21 cents per share in the YOY quarter. The estimated 2007 payout ratio is 73% based on 2007 estimated earnings of $1.20.

(click on table/chart for larger image)

Duke Energy and Washington Federal Dividend table. June 26, 2007
Duke Energy and Washington Federal stock chart. June 26,2007


Sunday, June 24, 2007

Municipal Bond Investors: No Smooth Sailing Ahead

A number of issues face municipal bond investors this year. Historically, muni bond investors were content collecting the tax free income a portfolio of municipal bonds generated. This year a number of events could impact the value of muni's, events beyond movement in interest rates.
  • Last month Standard & Poor's lowered Michigan's credit rating. The state's difficulties are directly related to Detroit's automobile struggles. These type of state issues could become more prevalent. Florida is an example where the states real estate and property tax woes could have a ripple affect on municipal budgets.
  • The Governmental Accounting Standards Board requires municipalities to calculate the amount owed to retirees in "other" post-employment benefits. However, in the state of Texas, the legislature has passed a bill that allows the state and municipalities to not follow this regulation. The bill has been sent to the Texas governor for signature. Even if the Governor does not sign the bill, the GASB regulation could have an impact on municipal credit ratings.
  • The last significant issue for municipal bond investors will be the Supreme Court's decision on the Kentucky vs. Davis case to be heard in the session that begins in October. At issue is whether states have a right to tax the municipal bond interest on out of state municipal bonds. Recent posts detailing some issue surrounding this case can be found below:
Source:
Smooth Ride Is Ending For Municipal Bond Investors
Bloomberg.com
By: Joe Mysak
May 30, 2007
http://www.bloomberg.com/apps/news?pid=newsarchive&sid=aa6g8IWDrTzs


Psychological Bias: Keep In Perspective

It is not an uncommon occurrence that ones investment decisions are guided by emotions. The emotional investment decisions tend to be influenced by past events that have already impacted the market. Often times investment decisions that "feel" the most uncomfortable are defined as contrarian investment strategies.

In an article by Marie Crawford Scott from the American Association of Individual Investors, she summarizes the contrarian investment style of David Dreman of Dreman Value Management.

In the article it is noted:
Investors tend to have hindsight blindness—they look at their past errors and feel that the mistake made would have been “obvious” if they hadn’t been blinded by an overly optimistic or overly pessimistic view. The problem with hindsight blindness, Mr. Dreman points out, is that it interferes with a proper assessment of past errors, and prevents the investor from learning from his mistakes.
According to Dreman, the trick for investors is to have the biases working for an investor versus against them. He has four rules that can be used to help investors avoid some common psychological or behavioral investment mistakes:
  • Rule 1: Don’t be influenced by a hot performance record.
  • Rule 2: Don’t rely solely on the specific situation, but take into account prior probabilities of similar situations. The greater the uncertainty, the less emphasis you should place on your own unique appraisal.
  • Rule 3: Don’t be seduced by recent rates of investment return for individual stocks when they deviate sharply from past norms. For investors, longer-term characteristics of stocks are far more likely to be established again.
  • Rule 4: Don’t expect the strategy you adopt to prove a quick success.
Applying this knowledge to today's market, many investor's were increasing exposure to real estate and REITs earlier this year. As noted in the charts below, real estate investment returns had been in a strong uptrend over the past few years. However, since February, the Dow Jones Wilshire REIT ETF (RWR) has declined 15% while the S&P 500 Index has increased 5%.

(click on charts of larger image)

REITs vs. S&P 500 Since 2003

REITs versus S&P 500 Index since 2003
REITs vs. S&P 500 Since 2007

REITs versus S&P 500 Index since 2007
How many investors increased exposure to international stocks in 2002 and 2003? Psychologically it may seem comfortable increasing exposure to international markets today as those markets have had strong returns.

(click on chart for larger image)

EFA vs. S&P 500 Index Since 2003

EFA ef versus S&P 500 Index since 2003
Maintaining exposure to international markets certainly seems appropriate since nearly 50% of the investment market capitalization is international. The point is not to chase returns.

Source:
Going Against the Crowd: A Look at the Contraian Investment Strategy ($)
American Association of Individual Investors
By: Maria Crawford Scott
July 1997
http://www.aaii.com/search/SearchResultsMore.cfm?StartAt=1&Site_Area=jrnl&Subject=ALL&Article_Type=ALL
&FromEdition=ALL&ToEdition=ALL&Author=ALL&StepSize=10&SearchText=psychology&SortOrder=&SortDir=Desc


Saturday, June 23, 2007

Medtronic Increases Dividend 11.4%

Yesterday, Medtronic (MDT) announced an 11.4% increase in the company's quarterly dividend to 12.5 cents per share versus 11 cents per share in the same period a year earlier. The company's 5-year historical dividend growth rate is 12%. The payout ratio on estimated 2007 earnings of $2.41 is approximately 21%.

Medtronic dividend analysis. June 23, 2007
Medtronic stock chart. June 23, 2007


Friday, June 22, 2007

Bullish Sentiment Increases

As reported by the American Association of Individual Investors, bullish investor sentiment saw an increase to 43.16% versus last week's 37.30%. This is the highest level recorded for bullish sentiment since April 19th's 46.94%. As the bullish sentiment has trended higher since the end of May, the S&P 500 Index has actually declined from 1,530.23 to 1,512.94 as of June 20, 2007.

(click on chart for larger image)

individual investor sentiment as of June 20, 2007


Thursday, June 21, 2007

State Street Corporation Increases Dividend 10%

Today, State Street (STT) announced a 10% increase in its quarterly dividend to 22 cents per share versus 20 cents per share in the same quarter last year. STT is a dividend growth stock that historically increases its dividend every third quarter. The payout ratio on estimated earnings in of $3.85 in 2007 is 23%. This is down from a payout ratio of 28% in 2006.

State Street Corp. Dividend table. June 21, 2007
State Street Stock Chart. June 21, 2007


Tuesday, June 19, 2007

The Yield Curve: Its Predictive Power

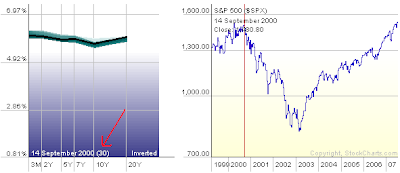
The yield curve is a graph of interest rates from short term to long term. In the U.S. the rates used are treasury security interest rates. The "normal" shape of the yield curve is where short term interest rates are lower than long term interest rates. Conversely, when short term rates are higher than long term rates the curve is said to be an "inverted" one.

Several factors impact the shape of the yield curve: inflation expectations, supply & demand and future expectations for economic activity to name a few. For example, if the yield curve is inverted, an investor might settle for a lower rate paid on a long term bond if the investor believes the economy will slow. A slower economy would indicate the Federal Reserve could lower short term rates below the level of long term rates in an effort to stimulate economic growth. This inversion tends to precede slower economic activity by up to a year. It should be noted that every inverted yield curve occurrence has not lead to a subsequent recession.

Yield Curve and S&P 500 September 2000

yield curve and S&P 500 index. September 2000
Yield Curve and S&P 500 March 2007

Yield curve and S&P 500 Index. March 2007Over the last week or so long term interest rates have experienced a rapid and relatively large move to the upside as noted in the following chart below. This move higher in longer term rates has resulted in an un-inverted curve.

historical 10-year treasury rates as of June 19, 2007What does this increase in interest mean for the economy? A good analysis is written by James Hamilton, professor of economics at the University of California, San Diego, titled More on those Rising Interest Rates.

Several other discussions on the yield curve are available by clicking the links detailed below:


High Dividend Growth Stocks

The Wall Street Journal's market data center contains a wealth of investing information. Following is a list of fast dividend growing stocks that are detailed by the Journal.

Fastest Dividend Growth Stocks as of June 18, 2007


Saturday, June 16, 2007

Target Increases Dividend 16.7%

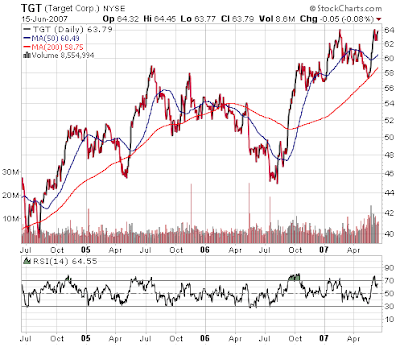
On Thursday, Target (TGT) announced a 16.7% increases in the company's quarterly cash dividend. The company also increased its share buyback program by $3 billion to $8 billion. Shares remaining to be repurchased under the program total $4 billion.
  • the quarter dividend increase to 14 cents per share versus 12 cents per share in the same quarter last year.
  • payout ratio on estimated 2008 earnings of $4.71 is approximately 12%.
  • Target's S&P Quality Ranking is A+.
(click on chart for larger image)

Target stock chart. June 15, 2007


Thursday, June 14, 2007

United Technologies Increases Dividend 18.5%

Yesterday, United Technologies (UTX) announced an 18.5% increase in the company's quarterly cash dividend to 32 cents per share versus 27 cents per share in the same period last year. The company's 5-year historical dividend growth rate is approximately 22%. The payout ratio on 2007 estimated earnings of $4.18 is approximately 31%.

(click on table/chart for larger image)

United Technologies dividend table. June 14, 2007
United Technologies stock chart. June 14, 2007


Bullish Sentiment Declines For Period Ending 6.13.2007

The American Association of Individual Investor's sentiment survey shows a decline in bullish sentiment for the period ending 6.13.2007. The bullish sentiment declined to 37.30% versus last week's 40.59%. The eight period moving average of bullish sentiment also continues in a down trend since the beginning of the year. However, since May 2005, the 8-period average is rising.

(click on chart for larger image)


Wednesday, June 13, 2007

Caterpillar and C.R. Bard Announce Dividend Increases

Caterpillar (CAT) announced a 20% increase in the company's 3Q dividend to 36 cents per share versus 30 cents per share in the same period last year. The company's 5-year average dividend growth rate is 11%. The projected payout ratio on estimated 2007 earnings of $5.70 is 25%.

Also, CR Bard (BCR) announced a 7.1% increase in its quarterly dividend to 15 cents per share versus 14 cents per share in the same quarter last year. The company's 5-year average dividend growth rate is 5%. The projected payout ratio on estimated 2007 earnings of $3.78 is 15.1%. BCR is one of Standard & Poor's Dividend Aristocrats.

(click on table/chart for larger image)

Caterpillar in CR Bard Dividend Table. June 13, 2007
Caterpillar and CR Bard stock chart. June 13, 2007


Tuesday, June 12, 2007

China Stock Valuations

Would you pay 147 times earnings for a company in today's market? In mainland China, Chinese investors are doing just that. Fortune Ng Food (Hebei) Co. is trading at that level. China Yurun Food Group Limited, a Hong Kong listed company in the same industry trades at 26.7 times earnings. In Singapore, People's Food Holdings Ltd. trades at 11.7 times earnings. As Greg Lesko of Delta Asset Management notes,
there is not that big a difference in their businesses, so there shouldn't be such a difference in their prospects and valuations.
According to Bloomberg, China's benchmark CSI 300 Index would need to fall as much as 54% to come in line with the price-to-earnings ratio of Hong Kong's Hang Seng China Enterprises Index, which tracks shares of 41 mainland companies listed in the city. The CSI 300 would have to drop 65 percent to match the average multiple for Chinese shares traded in Singapore, according to calculations by Bloomberg.

China government regulations are contributing to the overvaluation of Chinese shares.
Individual Chinese investors are opening brokerage accounts at the rate of about 300,000 a day this quarter, helping drive the CSI 300's 96 percent climb in 2007, the biggest gain in dollar terms among 90 benchmarks tracked by Bloomberg.
Jim Rogers, chairman of Beeland Interests Inc, notes:
Over time, the valuations on the mainland will have to come in line with other markets. Eventually, all the Chinese shares will sell for the same price everywhere. But that cannot happen until the currency is convertible and there's free arbitrage opportunities.
China's equity markets certainly seem to have moved into bubble territory. In the second quarter of this year, Chinese investors are opening brokerage accounts at the rate of 300,000 a day.

One way to invest in these markets and to limit the potential downside risk is through investments in structured notes. A related post on this type of investment can be found here.

Source

What Are China Stocks Worth? Singapore Shows 65% Less
Bloomberg.com
By: Chua Kong and Daniel Hauck
June 11, 2007
http://www.bloomberg.com/apps/news?pid=newsarchive&sid=aVyApTyKFC4Q


Sunday, June 10, 2007

Stock Buybacks Continue At A High Level

Last week, Standard & Poor's reported buyback activity actually accelerated in the first quarter of 2007. S&P estimates $117.7 billion was the level of buyback activity in the first quarter versus $100.2 billion recorded in the first quarter of 2006.

(click on chart for larger image)

stock buyback and dividend chart. June 10, 2007
Howard Silverblatt, senior Index Analyst at Standard & Poor's notes:
“Authorized buybacks and corporate actions are now matching up much better, with companies aggressively following through on authorizations. However, if companies wish to get the same level of impact on EPS as they did in prior years, they will have to invest more. With today’s higher share prices, the same buyback dollar doesn’t buy as many shares and therefore doesn’t reduce the share count by as much as it did in previous years.”
The interesting aspect of Howard Silverblatt's statement is the "impact on EPS" that is occurring as a result of the large buyback activity. It is estimated that nearly 50% of the growth in EPS in 2007 will come from the effect of lower share count on EPS. Investors will need to pay particular attention to company financial reports before they are converted to per share data to assure oneself growth is occurring on an absolute basis.

S&P also notes that since the buyback activity picked up in the 4th quarter of 2004, 58% of the S&P 500 companies have fewer shares now than at the beginning of 4Q 2004. They also cite the fact the top ten companies implementing buybacks account for 31% of all buybacks for the 12-months ending 3/31/2007.

Source:

S&P 500 1st Quarter Buyback Activity Sets Record at $118 Billion (pdf)
Standard & Poor's
By: Howard Silverblatt & David R. Guarino
June 8, 2007
http://www2.standardandpoors.com/spf/pdf/index/060807_500_BUYBACK.pdf


Retirement Payout Mistakes

When it comes to deciding how to take payouts from retirement accounts, Kiplinger's Magazine cites four mistakes that must be avoided and could be costly to a retiree.
  • Withdrawing money too soon: Maybe a not so obvious fact are the strict rules surrounding IRA withdrawals before the age of 591/2. These rules permit a retiree to begin withdrawing funds from a 401k at age 55. This is known as the "55 and out" rule. The ability to take advantage of this option rests with each employer. Not surprisingly, all employers do not allow for a retiring employee to take advantage of the 55 and out distribution rule. Additionally, if the 401k is rolled into an IRA, an IRA holder can take what is known as 72(t) distributions. This distribution arrangement requires the IRA owner to take "substantially equal periodic payments" over his or her life expectancy. The payments must continue for five years or until the IRA owner reaches age 591/2, whichever is longer.
  • Interrupting annual payments: If the 72(t) payments are stopped prior to meeting the term or age requirement, the IRA owner will owe penalties and interest on all payments taken up until the time they were stopped. More information on 72(t) distributions can be found at www.72t.net.
  • Taking a check for rollover proceeds: If one decides to transfer a 401(k) to an IRA or another employer's 401(k), the check should be made payable to the new custodian. If the check is made payable to the account owner, the employer will withhold 20% for taxes and the owner will need to come up with that amount to fund the new target account. Otherwise, the 20% will be taxed and assessed a 10% early withdrawal penalty.
  • Forgetting about your spouse: The article (link below) discusses the pros and cons of including ones spouse to receive survivor benefits. With the survivor benefit option selected, the retiree will likely receive a smaller benefit payout.

Source:
Four Costly Retirement Mistakes You Can't Afford To Make
Kipliner's Personal Finance
By: Mary Beth Franklin
June 2007
http://www.kiplinger.com/features/archives/2007/06/Retirement_Mistakes.html


Friday, June 08, 2007

June is Historically One of the Worst Performing Months of the Year

As detailed in the chart below, June is the second worst performing month of the year for the Dow Jones Industrial Average. This is second only to September; historically, the worst performing month of the year . This year, May's performance was slightly more than 4.6% and far above the historical average return for the month.

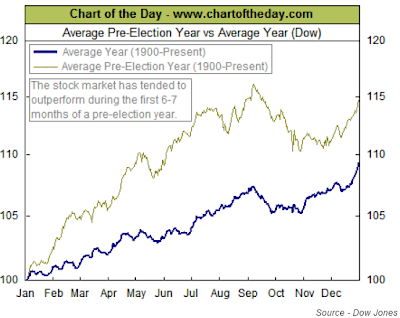
Dow Jones Industrial Average monthly return averageAdditionally, the equity markets tend to be strongest in pre election year periods. However, this outperformance tends to occur in the first 6-7 months of that year.


Thursday, June 07, 2007

H & R Block Increase Dividend 5.6%

Today, H & R Block (HRB) announced a 5.6% increase in the company's quarterly dividend. The new quarterly dividend increases to 14.25 cents per share versus 13.5 cents per share. The payout ratio based on fiscal 2007 estimated earnings of $1.16 increases to 49%. The 5-year average payout ratio is approximately 25%.

H & R Block dividend analysis table. June 7, 2007
h& R Block stock chart. June 7, 2007


Dividend Summary: May 2007

According to Standard & Poor's Monthly Dividend Action Report, total YTD dividend declarations have increased 4.7% versus 1.3% for the same 5-month period in 2006. On a 12-month YOY basis, declarations are up 2.4% versus 5.9% in the same 12-month period last year. As noted in the "increase" chart below, increases are actually down -3.2% versus up 6.4% YTD. Interestingly, "extras" are up 9.9% on a 12-month basis versus up 7.2% in the comparable period last year. Extras on a YTD basis are up only .6% versus up 16.4% in the same period last year. Although companies seem to be more focused on stock buybacks versus dividends, the dividend trend is still a positive one.

(click on charts for larger image)

dividend declarations. May 31, 2007dividend increases. May 31, 2007dividend extras. May 31, 2007
* The dividend information is based on the common (non-funds) listed on the ASE, NYSE, NGM, NNM and NSC:


Wednesday, June 06, 2007

Dividend Aristocrats Still To Announce Dividend Actions

Following is a list of the Dividend Aristocrats from Standard & Poor's that are anticipated to announce dividend increases/actions over the course of the next three months.


Monday, June 04, 2007

Dividend Analysis: May, 2007

Standard & Poor's does an excellent job providing dividend information for investors. The following detail through May 2007 was obtained from S&P's website.

The dividend action/detail for the companies in the S&P 500 Index as of the end of May, 2007 is as follows.

(click on table for larger image)

May 2007 number dividend increase
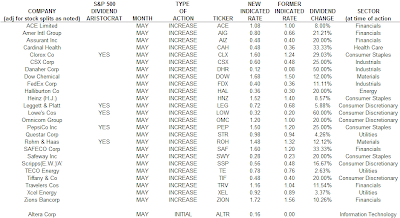
The one initiated dividend in May was Altera (ALTR) at 4 cents per quarter.

Following are the S&P 500 companies that had dividend actions in May:

dividend increases by company S&P 500. May2007


Friday, June 01, 2007

Dividend Payers vs. Non-payers Performance as of May 31, 2007

Standard & Poor's reported the performance of the dividend payers versus non-payers for the period ending 5.31.2007. On a year to date basis, the dividend payers' return slightly trials the non-payers' return, 10.59% versus 10.61, respectively. Historically though, the dividend payers have had a better risk adjusted return.

The overall return for the S&P 500 Index on a YTD basis is 8.77% as of 5.31.2007. On a 12-month basis, the dividend payers are outperforming both the non-payers and the overall S&P 500 Index as detailed in the chart below.

dividend payers versus nonpayers in S&P 500 Index as of May 31, 2007