Friday, March 30, 2007

April Tends To Be A Good Month For The Markets

Although the following chart shows that the best performing months are November and December, April is not bad either. The Chart of the Day details the monthly return for the Dow since 1950 (blue line) and 1980 (grey line). The old adage of sell in May and go away has historically been preceded by strong market returns in April.

(click on chart for larger image)


Thursday, March 29, 2007

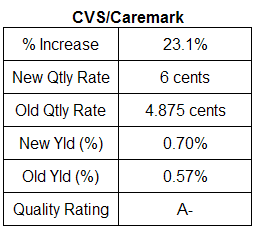
CVS/Caremark Announces 23.1% Dividend Increase

Today, the new CVS/Caremark (CVS) announced a 23.1% increase in the company's second quarter dividend. The new quarterly dividend will equal 6 cents per share versus 4.875 cents per share in the first quarter. CVS raised the quarterly dividend in January from 3.875 cents per share. As a result, on a YOY basis (2Q to 2Q) the dividend increase is 54.8%.

Additionally, the company commenced the previously announced tender offer to purchase up to 150,000,000 shares, or about 10%, of its outstanding common stock at a price of $35.00 per share. The offer to purchase shares, which is not conditioned upon any minimum number of shares being tendered, commenced today and will expire at 12:00 midnight, New York City time on April 24, 2007, unless extended.

(click on table/graph for larger image)

CVS/Caremark dividend analysis table
CVS/Caremark stock chart


Bears Less Bearish

Today's release of the American Association of Individual Investors Sentiment Survey shows a decline in bearishness. It appears the prior week's bearish voters are more neutral this week. As noted in prior posts, this indicator is a volatile one as well as a contrarian one. The percent bullish remains essentially unchanged.

(click on table for larger image)


Wednesday, March 28, 2007

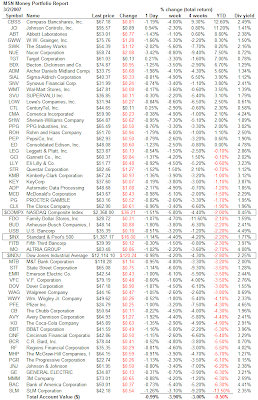
Dividend Aristocrats Performance as of 3 28 2007

The equity markets have been seeking a direction since the end of February. During days like today when the market trades down, the higher quality domestic equity portfolio has tended to outperform the broader market indices.

(click on chart for larger image)

S&P 500 Index chart March 28, 2007
As detailed in the performance summary below, the Dividend Aristocrats maintain a year to date performance edge over the broader large capitalization U.S. equity indices as of March 28, 2007.

(click on tables for larger image)

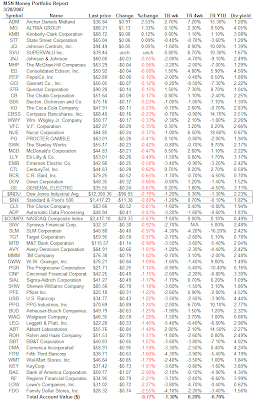
dividend aristocrat performance summary as of March 28, 2007
dividend aristocrat performance detail as of March 28, 2007


Tuesday, March 27, 2007

Abercrombie & Fitch Added To The S&P 500 Index

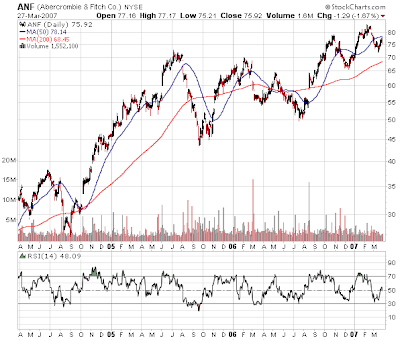
Today Standard & Poor's announced(pdf) that Abercrombie & Fitch (ANF) would be added to the S&P 500 Index after the close of trading on March 28, 2007. ANF will replace Univision Communications (UVN). Univision is being acquired by an investor group including Madison Dearborn Partners, Providence Equity Partners, Texas Pacific Group, Thomas H. Lee Partners and Saban Capital Group in a deal expected to close on or about that date, pending final approvals.

ANF is not a true dividend growth stock as the company's first dividend payment was the 1st quarter of 2004. Additionally, the company has not increased the dividend on every fifth quarter. On the other hand, the calendar year dividend has increased by 10 cents (approximately 16%) in each year since 2004.

(click chart for larger image)

Abercrombie & Fitch stock chart


Dividend Aristocrats Performance Update

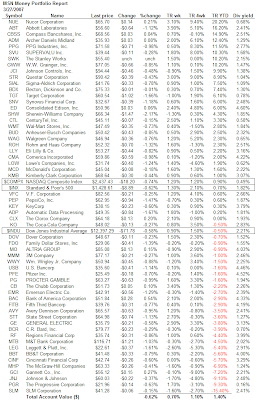
I took a few days off from blogging last week and the markets experienced a nice rebound. Not sure if there is a message in this or not. Last week, the Dividend Aristocrats portfolio gave up some ground to the general market. In looking at the holdings detail below, the one week return for the Aristocrats totals .70%. This compares to the Nasdaq return of 1.20% and the S&P 500 return of 1.30%. However, on a year to date basis the Aristocrats portfolio has generated a return of 1.40% versus a Nasdaq return of .90% and S&P 500 Index return of .70%.

(click on tables for larger image)

aristocrats performance summary March 27, 2007
aristocrats performance detail March 27, 2007


Monday, March 26, 2007

Standard and Poor's Adds Kraft to the S&P 500 Index

After the close of trading on March 30, 2007, S&P has announced Kraft (KFT) will replace Sabre Holdings (TSG) in the S&P 500 Index. KFT is being spun out from Altria Group.

(click on table/chart for larger image)

S&P 500 Index Changes March 30, 2007
Kraft Foods Chart
Source: Standard and Poor's


Bullish Sentiment Jumped Last Week

American Association of Individual Investors Sentiment Survey showed a jump in bullishness to bullish to43.88% versus the prior week's 32.99%. The increase in bullishness came at the expense of a decline in bearishness to 33.09% versus the prior week's 45.36%.

(click on table for larger image)

sentiment survey March 21, 2007


Tuesday, March 20, 2007

Short Break

I will be taking a few days off from blogging until Sunday, March 25, 2007. Until then, following are a few links that might be of interest:
  • Optionetics Weekly Outlook by Chris Tyler for March 19, 2007 notes: "In light of the recent bearish extremes and patterns in place, bullish opportunities do appear close at hand."


Dividend Rate on S&P 500 for 2007 Increased by S&P

Today, Standard & Poor's announced they were increasing the indicated dividend rate on the S&P 500 Index to $26.55 from $25.10. S&P estimates companies in the 500 will pay out $27.85 per share in 2007 versus $24.88 in 2006 and $22.22 in 2005. This represents a 11.9% increase in the dividend payment. Additionally, aggregate payments would total $252 billion in 2007 versus $222 billion in 2006.

As I noted in my post the other day regarding dividends and buybacks (click here) there is concern about the magnitude of buybacks. S&P notes:

“We are concerned that the large expenditures on buybacks may be inhibiting dividend growth,” continues Silverblatt. “While Standard & Poor’s has yet to see a significant decline in the number of dividend increases, the lack of increases, as well as the absence of new initiations, speaks to the current climate of buyback preference.”

Silverblatt points out that the tendency for index issues to pay and increase cash dividends is much greater than that of the general market as 77% of the S&P 500 constituents pay cash dividends versus just 40% for the non-S&P 500 companies. For 2007, Silverblatt estimates that over 60% of the S&P 500 will increase their dividend payout compared to just 30% for non-S&P 500 companies.


Monday, March 19, 2007

Upcoming Dividend Actions

Following is a list of S&P's Dividend Aristocrats that have dividend report dates through the second quarter. Historically, on these report dates the company would announce a dividend increase.

(click on chart or larger image)

aristocrat dividend actions 2nd quarter 2007


Sunday, March 18, 2007

Dividend Aristocrats Performance 3.16.2007

Over the course of the last four weeks, the U.S. equity markets gave up all the year to date gain that had been achieved until the last week of February. Although the Dividend Aristocrats have not been immune to this market pullback, they continue to outperform the S&P 500 Index, the Dow Jones Industrial Average and the NASDAQ Index.

(click on charts for larger image)

s&p 500 Index chart March 16, 2007
Dividend Aristocrat performance as of market close on 3.16.2007:


Dividend Aristocrats performance summary March 16, 2007

individual dividend aristocrat performance March 16, 2007


Friday, March 16, 2007

Stock Buybacks and Dividend Payments Remain Strong

Yesterday, Standard & Poor's issued a press release noting "S&P 500 4th Quarter Buybacks Remain Strong at $105 billion. Included in the release is the absolute dollar amounts of dividend and stock buybacks paid out by S&P 500 companies since 2001. When looking at the dividend payouts and stock buybacks combined, the so called dividend and buyback yield as of 12/31/2006 is 5.15%. This compares to the dividend & buyback yield of 2.63% as of 3/31/2001.
  • reported earnings have grown at a compound annual rate of 14.2% since the beginning of 2001.
  • the dividend growth rate has grown at a 10.6% rate.
  • buybacks have increased at a 22% rate over the six year time span 2001-2006.
  • As detailed on the chart below, the dividend payments/stock buybacks have grown at nearly the same rate as reported earnings.
One piece of data that can be deduced from the data in the press release is that S&P 500 companies have returned 85% of reported earnings to shareholders via dividends and/or stock buybacks since the end of 2000. From a dividend growth perspective, these buybacks are not long term payment commitments versus increasing and ongoing dividend payments. By not committing to longer term payments, what does this imply about a company's view of its own prospective growth opportunities? On the other hand, S&P notes "the impact of share count reduction on earnings per share was lower during the fourth quarter as more companies used the extra shares on hand for M&A activity and stock options." M&A activity certainly would be more positive than buybacks instituted to offset option dilution.

(click on graph for larger image)

dividend and buyback amounts for S&P 500 companies since 2001Data Source: Standard & Poor's

As noted in prior posts, the dividend payout ratio for the S&P 500 is running at near record lows. It would be nice to see some of the buyback cash diverted to dividend payments so as to project confidence in a company's longer term business prospects.


Thursday, March 15, 2007

Pre-Election Year Returns Update

Chart of the Day provides the following update for the Dow Jones Industrial Average pre-election year returns. Will history repeat itself?
"Today's chart illustrates how the stock market has performed during the average pre-election year. Since 1900, the stock market has tended to outperform during the first six to seven months of the average pre-election year. For the remainder of the year, pre-election performance has tended to be choppy. This pre-election year has, for the most part (the main exception being the Shanghai surprise of late February), been true to form."
(click on graph for larger image)


Air Products & Chemicals Raises Dividend 11.8%

Air Products & Chemicals (APD) announced an 11.8% increase in the company's second quarter cash dividend to 38 cents per share versus 34 cents per share in the same quarter last year.
  • In 2006, the company's dividend increase was only 6%.
  • The five year average dividend growth rate is 13%
  • The dividend yield on the new dividend rate increases to 2.07% versus the prior yield of 1.86%.
  • The payout ratio on 2007 estimated earnings of $4.11 equals 36%. The five year average payout ratio equals 37%.
(click on table/chart for larger image)

air products dividend increase table
air products stock chart


Bullish Sentiment Declines Again

The American Association of Individual Investors Sentiment Survey released today shows a further decline in investor bullishness. The percent of investors that are bullish on the market, looking out six months, declined to 32.99% from 35.80% last week.

(click on graph for larger image)

investor sentiment survey from american association of individual investors March 14, 2007


Wednesday, March 14, 2007

Wm. Wrigley Jr. Co. to Raise Prices 10%

Today Wm. Wrigley Jr. Co. (WWY), a Dividend Aristocrat, announced it was raising prices in the U.S. by an average of 10%. As the news was announced early this afternoon, the stock began moving higher as noted in the 1-day chart below. Wrigley was the top performing aristocrat today.

(click on graph for larger image)

Wm Wrigley Jr. Co. one day stock chart
top 5 dividend aristocrats March 14, 2007
On a longer term basis, WWY stock price has struggled to keep pace with the general market, but with a new CEO, maybe this is the stimulus the company needed.

Wm Wrigley Jr. Co three year stock chart
Wrigley is a dividend aristocrat and patient investors have collected increasing dividends as the company is likely transitioning into a brighter earnings future.


Tuesday, March 13, 2007

Red-Letter-Day In The Market

Only one industry group generated a positive return today. I presume it is appropriate the group was the Travel and Tourism Industry. Today would have been a good day to take a vacation. This industry group achieved a .03% positive return.

S&P's Dividend Aristocrats were essentially down in line with the major domestic indices as well today. Though, on a year to date basis the Aristocrats are down only -1.40%.

(click on tables for larger image)

aristocrat performance summary March 13, 2007
aristocrat performance for March 13, 2007


Qualcomm Announces 16.7% Dividend Increase

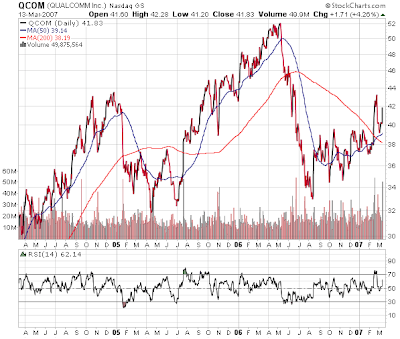
Qualcomm (QCOM) is not a true dividend growth equity since dividends were just initiated in the first quarter of 2004. However, today the company announced a 16.7% increase in the company's dividend to be paid in the second quarter. The new quarterly dividend will equal 14 cents per share versus 12 cents per share in the same quarter last year. The S&P Earnings and Dividend Ranking is B.

(click on chart for larger image)

Qualcomm stock chart


Monday, March 12, 2007

Another REIT added to the S&P 500 Index

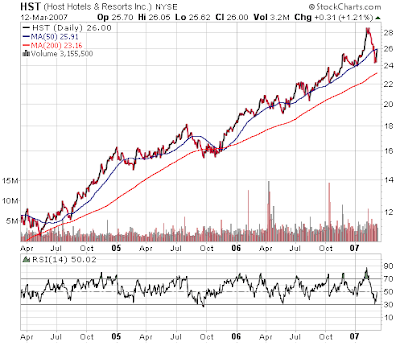
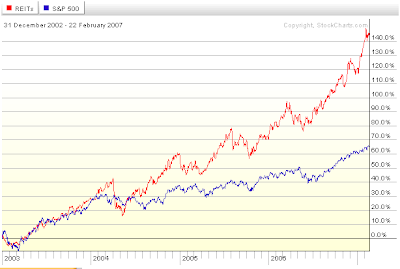
Today, Standard & Poor's announced Host Hotels and Resorts (HST) will be added to the S&P 500 Index at a date to be announced later. HST will replace Phelps Dodge (PD) as PD is being acquired by Freeport-McMoRan Cooper and Gold Inc. (FCX). HST will be the thirteenth REIT added to the S&P 500 as noted in an earlier blog post. The FCX/PD deal still needs to be approved.

(click on charts for larger image)


HST stock chart
REIT index performance versus S&P 500 Index


Sunday, March 11, 2007

Determining an Asset Allocation in Retirement

As an investor approaches retirement age, the amount of investment funds available to them is a critical issue. Once an acceptable asset level is reached, entering retirement certainly seems to become a reality. Once retired a retiree does not want his or her investment assets exposed to significant declines due to downside investment market volatility.

The public portion of the American Association of Individual Investors' website contains an article, Retiree Stock Allocation Recommendations: Do You Fit the "Mold"? by William Reichenstein, CFA. The article discusses the differences in asset allocation recommendations among the various "lifestyle" type mutual funds from fund families like Vanguard, T. Rowe Price, to name a few. The recommended allocation to stocks ranges from 20% to 40% for retirees of the same age. An excerpt from the article notes:
Why the differences?

The recommendations for a 20% stock allocation most likely come from evidence from historical returns indicating that portfolios containing these stock exposures have a risk that is no higher than an all-bond portfolio, a risk level that is appropriate for a shorter-term time horizon.

The higher recommended stock allocations most likely are based on studies concerning withdrawal rates during retirement.

For example, one recent study found that, for individuals withdrawing funds each year from their portfolio, the probability of not outliving retirement resources was maximized when initial withdrawal rates were kept below 5% (with subsequent withdrawals increasing with inflation). For a 4.5% initial withdrawal rate, the probability was maximized with portfolios consisting of 40% stocks and 60% fixed income (including both bonds and cash) over a 30-year time horizon, while for a 4% initial withdrawal rate, the probability is maximized with an allocation of 30% stocks and 70% fixed income. [For a complete description of this study, see "Bear Market Strategies: Watch the Spending, Hold the Stocks," a study by T. Rowe Price, in the May 2003 AAII Journal].

So, who should you believe—the 20% crowd or the 35% to 40% crowd?
A retiree's/investor's allocation to stocks/bonds/cash depends on a number of factors. The article provides a cursory review of some of these factors, for example, time horizon, asset levels, withdrawal rates, and a retiree's health.

Lastly, a brief analysis is provided regarding international diversification and the potential drag on returns that cash can create over longer periods of time.

Source:
Retiree Stock Allocation Recommendations: Do You Fit the "Mold"?
American Association of Individual Investors
By: William Reichenstein, CFA
http://www.aaii.com/features/jrnl200402p25.pdf


Year To Date Dividend Growth Rate

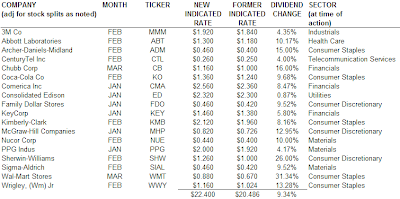
On a year to date basis, S&P's Dividend Aristocrats that have announced dividend actions, have a rate of increase of 9.34%. When looking at all YTD dividend actions for S&P 500 companies, the rate of increase is 12.6%. Following is a list of the Aristocrats that have announced dividend actions this year.

(click on table for larger image)

aristocrats dividend increases March 2007
Source: Standard & Poor's


S&P 500 50th Anniversary

Standard & Poor's has published a collection of data relevant to the 50th anniversary of the S&P 500 Index. Since 1957, 87 companies remain in the index since it was formulated in 1957.

(click on table for larger image)


Additionally, S&P has included several articles that appeared in the first issue of the company's newsletter The Outlook. A featured company reviewed in the first issue is General Electric on page 4 of the link.


Friday, March 09, 2007

Wal-Mart and Colgate Palmolive Announce Dividend Increases

Yesterday, Wal-Mart (WMT) and Colgate Palmolive (CL) announced increases in their quarterly dividends.

Wal-Mart:
  • 31.3% increase in the quarterly dividend to 22 cents per share versus the prior 16.75 cents per share.
  • S&P Earnings and Dividend Quality Ranking of A+
Colgate Palmolive:
  • 12.5% increase in the quarterly dividend to 36 cents per share versus the prior 32 cents per share.
  • S&P Earnings and Dividend Quality Ranking of A+

Wal-Mart and Colgate Palmolive stock charts


Thursday, March 08, 2007

Dividend Aristocrats Performance as of 3.8.2007

Standard & Poor's Dividend Aristocrats continue to outperform the the S&P 500 Index, NASDAQ and Dow Industrials Average on a year to date basis through 3.8.2007. On the day, the Aristocrats outperformed the previously mentioned indices as well. Only four of the Aristocrates ended the day in negative territory today: Wal-Mart (WMT), Lowes (LOW), SLM Corp. (SLM) and Johnson (JNJ)

(click on tables for larger image)

S&P Aristocrats performance summary as of March8, 2007
S&P's dividend aristocrats table as of March 8, 2007


Bullishness Declines Further: March 7, 2007

The American Association of Individual Investors sentiment indicator for the period ending March 7, 2007 showed a decline in bullish sentiment to 35.8%. Last week's bullishness level was 36.6%. This contrarian indicator tends to be a volatile one.

(click on graphic for larger image)

sentiment indicator March 7, 2007


General Dynamics Increases Dividend

Yesterday, General Dynamics (GD) announced the company would increase its dividend 26%. The new quarterly rate increases to 29 cents per share versus 23 cents per share in the same quarter last year. GD has an A+ S&P Earnings and Dividend Quality Ranking.

(click on chart for larger image)

General Dynamics Stock Chart


Tuesday, March 06, 2007

What a Difference a Day Makes

The Dow Jones Industrial Average rose 157 points today. Technical analysis of today's market action is contained at the Alpha Trends site by clicking here.

Following is an update of the performance of the Dividend Aristocrats. The major U.S. domestic indices did fair better than the Aristocrats today; however, on a year to date basis, the Aristocrats continue to outperform the previously mentioned indices.

(click on tables for larger image)

dividend aristocrat performance summary March 6, 2007
Dividend Aristocrat Performance by issue March 6, 2007


Dividend Aristocrats Performance Summary as of 3.5.2007

As of Monday March 6, 2007 the Dividend Aristocrats have generated a negative year-to-date return of -1.50%. The Dow, S&P 500 Index and NASDAQ all have negative returns greater -3.0%.

(click on tables for larger image)

dividend aristocrat performance summary March 6, 2007 dividend aristocrat performance March 6, 2007

(Note: performance should be is as of March 5, 2007)


Monday, March 05, 2007

Market Map Through End Of Last Week

USA Today provides a graphical summary of sector and individual stock returns through the end of last week. The chart details stocks that were up last week. The article notes:
China woes ripple through U.S. markets

What happens in China apparently doesn’t stay in China. A sharp sell-off last week on the Chinese stock market shook up markets all over the world. Every industry group fell as the U.S. market dropped 4.4% during the week. Not every industry suffered equally. Several industries viewed as risky or tightly tied to the economy, such as autos, financials and semiconductors, fell more than 6% for the week. More stable industries, such as utilities, were relatively spared with a 2% weekly decline. Investors will be watching “beige book” reports due this week for clues about the U.S. economy’s health.
(click on chart for pdf link)

market sector map March 3 2007
Source

USA Today
March 5, 2007
http://www.usatoday.com/money/markets/sectorwatch/2007-0305.pdf


Chubb Announced Dividend Increase On Friday

On Friday, Chubb (CB) announced a 16% increase in its quarterly dividend to 29 cents per share versus 25 cents per share in the 1st quarter of 2006. The yield on the new dividend increases to 2.3% versus the prior 2.0%. The 5-Year average payout ratio is 26%. The projected payout ratio on 2007 earnings estimate of $5.32 is 22%. Chubb is one of S&P's Dividend Aristocrats with an Earnings and Dividend Quality Ranking of B+.

(click on chart for larger image)

Chubb Stock Chart


Saturday, March 03, 2007

Market Pullback: Now What? (Follow Up To 2/28 Post)

The Dow Jones Industrial Average is down 2.84% on a year to date basis. That does not sound like a market plunge or correction to me. Over the last 52-weeks, the Dow is up 9.91%. Certainly, this past week's decline of 4.22% is causing investors to review their investment portfolios and reassess their overall asset allocation, i.e., between stocks, bonds, cash, etc.

An investor should review their overall tolerance for risk just as they should have done during the market correction following the bursting of the technology bubble in 2000. An important question that each investor can only answer themselves is what minimum asset value puts their retirement, retirement goals or simply overall investment goals at risk. This evaluation process needs to be done even when the market is rising. It is better to buy low and sell high. Before this recent pullback, has the allocation between the various investments gotten out of line with ones original intentions? The rebalancing of ones investments is an ongoing process and should not just be done when the markets are declining.

Assuming all is well at this point, now what is an investor to do? There is an interesting post at Alpha Trends web site titled Adjusting For Higher Risks. The author theorizes the worst is behind us and the "natural question is what should be bought?" A couple of paragraphs from the post:
"What makes people want to buy a stock? There are many factors which people consider before purchasing a stock and while we primarily focus on the technicals, there is another group of participants whose focus is on the fundamentals of the company. I am not going to tell you that fundamentals really matter to me, because they don’t. I’m just looking for stocks that will go higher.

There is a large portion of investors who consider fundamentals to be the most important thing to consider before purchasing a stock. To me, the PE ratio is as valuable as the MACD or a moving average. By that I mean that by themselves, they are useless…that’s right, you read it correctly. The value of any market measurement is not in the literal interpretation, but in the correct assessment of determining when they will be considered important enough to a large group of participants to make a decision to buy or sell decision. If a widely followed indicator can be used to clue us to a potential move in a stock we cannot ignore it, that is common sense."
As the article notes, one thing an investor can do at this time is to construct a list containing stocks that might be attractive purchase candidates. The article is well worth reading.

In order develop the list, several websites do offer screening capabilities, some better than others. Following are links to a few of the sites where one can begin their research.
Lastly, at Bill Cara's Capital Markets website, he has a post (click here) listing a number of investments--stocks (by sector), etfs and bonds--detailing price performance over various time periods.

These are just a few links where one can begin their search process.


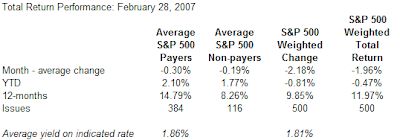
Dividend Payers Versus Non-Payers: February 28, 2007

The dividend payers in the S&P 500 Index underperformed the non-payers in the month of February. However, over the trailing 12-month period, the payers have a significant performance edge versus the non-payers, 14.79% versus 8.26%, respectively.

(click on table for larger image)

performance S&P 500 Index dividend payers versus non-payers


Friday, March 02, 2007

Dividend Aristocrats Down Less Than 1% Year To Date

On a year to date basis, the Dividend Aristocrats are down .5% versus a 2% or greater decline in each of the S&P 500 Index, the Dow Jones Industrial Average and the NASDAQ Index.

(click on tables for larger image)

dividend aristocrats performance summary March 2, 2007
dividend aristocrats portfolio performance March 2, 2007


Dow Jones Industrial Average Remains in an Uptrend

From Chart of the Day:

Investors are very concerned about the future direction of the stock market following Tuesday's significant drop. For some perspective, today's chart illustrates the current trend of the Dow. It is interesting to note that as it currently stands, the Dow has backed off from resistance (red line) and subsequently moved right down to an intermediate term trend line (gray dashed line). So while a sell-off in Shanghai directly influenced markets around the globe, it is worth noting that many of these markets had been rallying themselves and we're exhibiting signs of being overbought.

(click on chart for larger image)
Dow Jones Industrial Average Chart March 1, 2007


Thursday, March 01, 2007

Warren Buffett: Annual Shareholder Letter Released Today

If you only read one shareholder annual letter, it should be the one released by Warren Buffett of the famed Berkshire Hathaway (BRK.A). His 2006 letter was released today and can be read by clicking here.


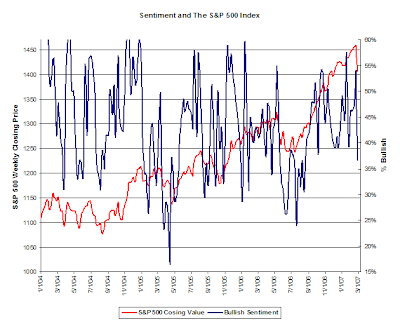
Sentiment Following The Market

The American Association of Investors Sentiment Survey shows a decline in bullish sentiment to 36.63% versus 53.85% in the prior week. This level of bullishness is the lowest level the indicator has returned since 8/17/2006 when bullishness equaled 30.53%. This contrarian indicator tends to be somewhat volatile. The level of bullishness hit a 2006 low of 23.85% prior to the market rally that began mid-year 2006.

(click on charts for larger image)

investor sentiment table February 28, 2007
investor sentiment chart February 28, 2007