Thursday, February 28, 2008

Bullish Sentiment Moves Higher For Third Straight Week

The American Association of Individual Investors reported that bullish investor sentiment moved higher for the February 27th reporting period. Bullish investorsentiment increased to 34.31% versus last week's reading of 33.18%. At the same time, bearish sentiment also moved higher.T he bearish level was reported at 45.26% versus last week's 44.70%. This is the third week in a row that both bullish and bearish sentiment trended higher. The bull/bear spread did improve slightly at -11% versus last week's spread of -12%.

(click on chart for larger image)

bullish investor sentiment chart February 27, 2008


Monday, February 25, 2008

Kimberly-Clark Corp. Increases Dividend 9.4%

Kimberly-Clark (KMB) announced a 9.4% increase in the company's quarterly cash dividend. The new quarterly dividend increases to 58 cents per share versus 53 cents per share in the same period last year. The company's projected payout ratio is approximately 51% based on 2008 estimated earnings of $4.57. The 5-year average payout ratio is approximately 50%. KMB has an S&P Quality Ranking of A.

(click on chart for larger image)

Kimberly Clark dividend analysis table
Kimberly Clark stock chart


Sunday, February 24, 2008

S&P 500 Index Settling Into An Uptrend?

On January 22, 2008 the S&P 500 Index seems to have established a market bottom, at least on an interim basis. At this same point in time, the percentage of stocks trading above their 200 day moving average hit a low of approximately 15%. Since late January, the percentage of stocks trading above their 200 day MA has trended higher to 23%. In addition to an increase in this moving average percentage, the S&P 500 Index has trended higher as well. A chart of each one of these indices is detailed below.

(click on charts for larger image)

percentage of S&P 500 Index stocks trading above 200 day moving average F
S&P 500 Index chart February 22, 2008
Many market technicians believe there is a high likelihood the S&P 500 Index will retest the January low. From a contrarian perspective, if the consensus believes in this retest, maybe it will not occur.


Saturday, February 23, 2008

Dow/Gold Ratio: What The Ratio Might Be Projecting

The below chart notes the Dow Jones Industrial Average has been in an eight year bear market since 2000 when priced in gold. Could it be the trend is in the midst of changing directions? Chart of the Day notes:
The Dow currently trades 13% below its all-time record high. For some further perspective into how the stock market is actually performing, today's chart presents the Dow divided by the price of one ounce of gold. This results in what is referred to as the Dow / gold ratio or the cost of the Dow in ounces of gold. For example, it currently takes 12.9 ounces of gold to “buy the Dow.” This is considerably less than the 44.8 ounces back in the year 1999. When priced in that other world currency (gold), the Dow is in the midst of a massive eight year bear market!
(click on chart for larger image)


Certain factors noted below may indicate the strength in Gold prices could be waning.
  • the April 2008 Gold contract settled at $947.80 on Friday. This is down from a high of $958.40 on Thursday. Traders also said technical selling could accelerate if prices fell below major support level at $945 an ounce.
  • the April 2008 crude oil price settled lower on Friday at $98.81. Lower crude prices reduce inflationary pressures and reduce the attractiveness of gold.
  • A steep drop in physical demand due to record bullion prices also hit sentiment. The World Gold Council said India's gold imports in January fell 72% from a year ago to around 24 tonnes.
Although gold is in an uptrend, the below chart notes it is trading at overbought levels.

(click on chart for larger image)

Gold Chart February 22, 2008
Source: Alpha Global Investors

Additional Source:

U.S. Gold Futures Drop On Pre-Weekend Selling
Reuters UK
February 22, 208
http://uk.reuters.com/article/marketsNewsUS/idUKN2239936620080222?rpc=401&


Thursday, February 21, 2008

Bullish Sentiment Essentially Unchanged

This week's investor sentiment survey from the American Association of Individual Investors indicated bullish sentiment was essentially unchanged from last week. The bullish sentiment level was reported at 33.18% versus the prior week's reading of 33.33%. This week's bullish reading remains below the long term average of 39%.

(click on table/chart for larger image)

investor sentiment versus long term average February 20, 2008


Monday, February 18, 2008

Portfolio Risk Reduced With Combination Of Bonds And Stocks

A combination of stocks and bonds in ones investment portfolio can reduce the overall risk or volatility of investment results. It should be noted though that the bond component of the portfolio will reduce the overall return of ones investments in the long run. On the other hand the bond allocation has been shown to reduce the magnitude of negative returns in down equity markets.

A recent article in the American Association of Individual Investors summarizes returns given various portfolio allocations. The article notes several lessons to be learned from the behavior of the portfolios over different market cycles.
Lesson One: Mixing bonds and stocks moderates portfolio risk.
High-grade bonds and stocks are fundamentally different assets. Bad years for bonds are sometimes good years for stocks and vice versa. During this time period, bonds lost money in three of those years, and in those same years stocks earned money. Conversely, stocks lost money in four of those years, and at the same time, bonds earned money. It is also important to note, though, that 1987 and 1994 were below-average years for both asset classes—that serves as a reminder that both asset classes can have poor years at the same time.

Lesson Two: Portfolio risk rises disproportionately slowly as stocks are added to the portfolio.
Over this time period, the risk (as measured by volatility) of a 25% stock portfolio was essentially the same as the risk of the all-bonds portfolio. The additional risk of a 50% stock portfolio compared to an all-bonds portfolio is one-fourth the additional risk of an all-stocks portfolio.

Lesson Three: An all-bonds portfolio is not the lowest-risk portfolio.
Even risk-averse investors should own some stocks. The maximum annual loss for a 25% stock portfolio was less than the maximum for the all-bonds portfolio. That's because, when interest rates rise, all bond prices move south.

Lesson Four: Portfolio returns rise disproportionately quickly as stocks are added to the portfolio.
Over this time period, the 25% stock portfolio earned about 40% of the additional return on the all-stocks portfolio compared to the all-bonds portfolio. The 50% stock portfolio earned about 75% of the additional return.

Lesson Five: An often-overlooked risk for the long-run investor is the risk of having a too-conservative portfolio.
By focusing too much on volatility of individual assets instead of the volatility of the entire portfolio, many people often maintain a too-small stock exposure for their long-run horizon. Remember that over this time period, the 25% stock portfolio had a volatility similar to the all-bonds portfolio, but its returns were appreciably higher. And for many investors, the risk-return trade-off favors an even higher exposure to stocks.
A summary of the portfolio returns is detailed in the below chart.

(click on table for larger image)

portfolio returns various asset allocations stocks bonds
Source:
Five Big Lessons From Recent Market History ($)
American Association of Individual Investors
2008
http://www.aaii.com/portfoliomanagement/


Saturday, February 16, 2008

A Few Foreign Dividend Paying Stocks

Dividend paying stocks are not unique to the U.S. equity markets. In the recent edition of S&P's Outlook newsletter, dividend paying stocks in the S&P Euro 350 Index were highlighted. Standard and Poor's ran a screen:
"...for foreign companies within S&P Equity Research’s coverage universe that trade as American Depositary Receipts or Shares on a U.S. exchange, are ranked four or five STARS, and have a dividend yield higher than that of the S&P 500."
The list of stocks that meet the screening criteria are detailed below.

(click on table for larger image)

foreign dividend paying stocks in S&P Euro 350 Index February 16, 2008
Source:

Foreign Dividends ($)
The Outlook
Standard and Poor's
February 20, 2008
http://www.outlook.standardandpoors.com/NASApp/NetAdvantage/servlet/login?url=/NASApp/NetAdvantage/index.do


Thursday, February 14, 2008

Slight Decline in Bullish Investor Sentiment: 2.13.2008

In the release of the American Association of Individual Investors' sentiment survey this week, bullish sentiment saw a small decline to 33.33% versus last week's bullishness level of 34.11%. The bull/bear spread did narrow to a negative 9% versus last week's negative 13%. The improved spread was due to a decline in bearish sentiment to 41.86% versus the prior week's 47.20%.

(click on chart for larger image)

investor sentiment graph February 13, 2008


Tuesday, February 12, 2008

Shareholders See The Sun Rise at SunTrust

Today SunTrust Banks (STI) announced a 5.48% increase in the company's quarterly cash dividend. The new quarterly dividend is increased to 77 cents per share versus 73 cents per share in the same period last year. The projected payout ratio will total 62% versus the 5-year average payout ratio of 45%. The new payout ratio has trended higher compared to the 2003 payout ratio of 38%. SunTrust has an S&P Quality Ranking of A.

(click table/chart for larger image)

SunTrust dividend analysis table February 12, 2008
SunTrust stock chart February 12, 2008


Monday, February 11, 2008

3M Increases Dividend 4.2%

3M Company (MMM) announced a 4.17% increase in the company's quarterly dividend. The quarterly dividend increases to 50 cents per share versus 48 cents per share in the same quarter last year. The projected payout ratio is approximately 37% based on estimated 2008 earnings per share of $5.45. This compares to the 5-year average payout ratio of 38%. The company has an S&P Quality Ranking of A+.

(click on table/chart for larger image)

3M dividend analysis table February 10, 2008
3M stock chart February 10, 2008


Saturday, February 09, 2008

The Anatomy of a Recession and the Market

Generally the stock market is a fairly good predicator of future activity as it relates to the economy or individual stocks or stock sectors. If that is the case, what might recent market declines suggest about current and future economic activity?

Many economists and traders believe the economy is near or already in some type of slowdown or even a recession. As Liz Ann Sonders, Chief Investment Strategist at Schwab recently noted:
"Cementing many a recession forecast was the most recent jump in the unemployment rate to 5%, bringing the total increase from this cycle's low to 0.6%. That may not sound significant, but an increase of this magnitude has never occurred in a soft landing, only during recessions."
What has historically been evident is the markets anticipate periods of economic weakness. If this is the case, then maybe the worst of the market performance is behind us. As noted in the last column of the table below, significant returns have been the result "after" the recession begins through a period six months after the end of the recession.

(click on table for larger image)

market performance around recessions
Graphically, the average S&P 500 performance during the past nine recessions is detailed below.

market anticipates recession
Source:
Looking Through the Valley to Recovery
Charles Schwab & Co.
By: Liz Ann Sonders
January 18, 2008
http://www.schwab.com/public/schwab/research_strategies/market_insight/todays_market/recent_commentary/looking_through
_the_valley_to_recovery.html?cmsid=P-2316791&lvl1=research_strategies&lvl2=market_insight&refid=P-1043565&refpid=P-1004186


Thursday, February 07, 2008

Bullish Investor Sentiment Continues to Move Higher

In the recent release of the American Association of Individual Investors' sentiment survey, investor bullishness moved higher as of February 6, 2008. The level of bullishness moved up to 34.11% versus last week's 30.08%. Additionally, the bull/bear spread narrowed to -13% versus -39% five weeks ago. On the other hand, the 8-period moving average of the bullish sentiment level has been on an eight week decline. The recent 8-period average of 28.1% compares to 36.5% for the week of December 20, 2007.

(click on graph for larger image)


Wednesday, February 06, 2008

L-3 Communications, Wm. Wrigley Jr. Co. and Cincinnati Financial Announce Dividend Increases

L-3 Communications (LLL), Wm. Wrigley Jr. Co. (WWY) and Cincinnati Financial Corp. (CINF) recently announced increases in their company's cash dividend.

L-3 Communications

  • the company's dividend increases 20% to 30 cents per share versus 25 cents per share in the same period last year.
  • the projected payout ratio is approximately 18% based on 2008 estimated earnings of $6.59. This compares to the company's 4-year average payout of 15%.
  • The company has an S&P Quality Ranking of A-.
Wm. Wrigley Jr. Company
  • the company's dividend increases 13.8% to 33 cents per share versus 29 cents per share in the same period last year.
  • the projected payout ratio is approximately 53% based on 2008 estimated earnings of $6.59. This compares to the company's 5-year average payout of 47%.
  • The company has an S&P Quality Ranking of A+.
Cincinnati Financial Corp.
  • the company's dividend increases 9.9% to 39 cents per share versus 35.5 cents per share in the same period last year.
  • the projected payout ratio is approximately 54% based on 2008 estimated earnings of $6.59. This compares to the company's 5-year average payout of 39%.
  • The company has an S&P Quality Ranking of A.
(click on table/chart for larger image)

CINF LLL WWY dividend analysis February 5, 2008
CINF LLL WWY stock chart February 5, 2008


Sunday, February 03, 2008

Housing Slowdown: How Long Will It Last?

My sense is the housing slowdown may not improve until late 2008 or into early 2009. Many sellers believe lower mortgage rates will stimulate buying activity as spring approaches. Consequently, sellers have not been too aggressive in lowering their selling price. Conversely, buyers believe prices should be substantially lower than where they stand today.

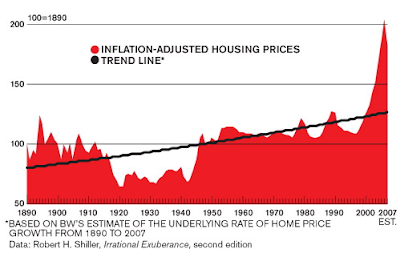
BusinessWeek wrote an interesting article in this week's issue titled the Housing Meltdown. The article notes house prices remain far above a long term trend line.

(click on chart for larger image)

Housing Prices Long Term Trend LineAlso, BusinessWeek notes:
"These regional pie charts show the results of a December survey of 1,509 homeowners asking whether they thought their home's value had risen or fallen over the past year. The survey was conducted by Harris Interactive for Zillow.com. Beneath each pie chart is Zillow.com's estimate of the actual change in house prices for the region over the past year."
(click on chart for larger image)

Percentage of Sellers Who Believe Home Prices Have Not ChangedAs noted in the above chart, a small percentage of homeowners believe the price of their home has declined. This type of thinking is extending the housing slowdown. Once sellers get through the summer and find they still have not sold their home, they will likely become more aggressive in lowering the home sale price. This event could act as a stimulant to reduce housing inventory and finally provide stability in the housing market.

Lastly, the chart below shows:
"A 20% decline in home prices would wipe out all of the home equity of two-thirds of all people who bought houses in the last year, Zillow.com estimates. The bars show the percentage of recent buyers in each market whose home equity would be wiped out by a further 20% price decline."
(click on graph for larger image)

Drop in home equity if prices fall 20%

Source:
Housing Meltdown
BusinessWeek
By: Peter Coy
January 31, 2008
http://www.businessweek.com/magazine/content/08_06/b4070040767516.htm?chan=magazine+channel_top+stories


Saturday, February 02, 2008

Aflac Increases Dividend Nearly 30%

On a year over year basis, Aflac (AFL) increased its quarterly dividend 29.7%. The new dividend increases to 24 cents per share versus 18.5 cents per share in the same period last year. Aflac's recent dividend history is detailed below.

(click on table for larger image)

Aflac historical dividend table
Aflac's estimated payout ratio is approximately 25% based on 2008 estimated earnings of $3.87. The five year average payout ratio is 19%. The company carries an S&P Quality Ranking of A.

(click on table/chart for larger image)

Aflac dividend analysis table February 2, 2008
Aflac stock chart February 2, 2008


Friday, February 01, 2008

Dividend Payers Outperform in January

The dividend payers in the S&P 500 Index outperformed the non-payers for the month of January.

(click on table for larger image)


The usual dividend leaders are the financial stocks; however, in January, the financial sector had a number of adverse dividend actions. According to S&P:
...Financials (ABK, C, FHN, and MBI) lowered their rate and two (PGR and SOV) suspended it. While there is still concern over the deterioration within the Financials sector, S&P believes the vast majority of S&P 500 companies will continue their long history of dividend payments and increases in 2008.
S&P stills sees dividend growth for 2008 versus 2007 to be in the 9.3% area.