Friday, August 21, 2015

Oversold Technical Indications, Market May Be Due For A Bounce

The market action on the last two days of this week was not kind to equity investors. The Dow Jones Industrial Average closed down 530 points today and closed the week in correction territory, i.e., down 10% from its May high. The S&P 500 Index has not reached correction territory though, down 7.5% from its closing high on May 21st.

From The Blog of HORAN Capital Advisors

The pullback this week in the S&P 500 Index and the Dow has resulted in oversold market conditions that historically have resulted in a subsequent market bounce. The equity put/call ratio closed today at 1.04 and levels above one are indicative of overly bearish market sentiment.
The equity P/C ratio tends to measure the sentiment of the individual investor by dividing put volume by call volume. At the extremes, this particular measure is a contrarian one; hence, P/C ratios above 1.0 signal overly bearish sentiment from the individual investor. This indicator's average over the last 5-years is approximately .635 indicating the individual investor has been generally mostly bullish and more active on the call volume side.

From The Blog of HORAN Capital Advisors

Another indication the market is oversold is the percentage of stocks trading above their 50 and 200 day moving averages. Both of these measures show the extent of the weakness in the market. The 200 day moving average is approaching levels last reached during the fiscal cliff period/sell off in the later half of 2012.

From The Blog of HORAN Capital Advisors

From The Blog of HORAN Capital Advisors

We noted in articles in April and May of this year that those smaller pullbacks at that time were not likely the beginning of a correction. Activity this week certainly qualifies for that correction.

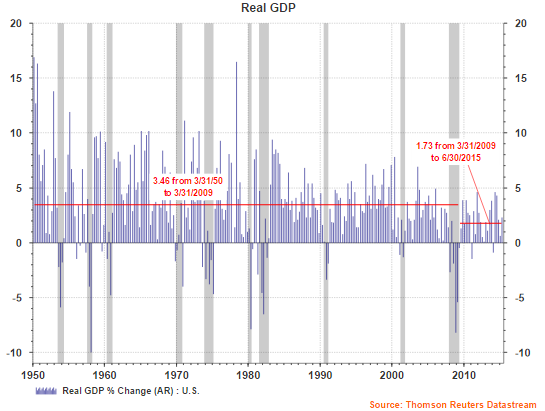
The dog days of summer are now showing their colors. The question for investors is whether this pullback is one that will extend into a bear market, i.e., down 20%. This is difficult to predict; however, we do believe economic activity in the U.S. and in developed markets outside the U.S. continue to show growth, albeit slow.
  • The weakness seen in emerging markets along with their currency depreciation policies, certainly are of concern. We do not believe a full blown currency war occurs as this will benefit no country.
  • Japan's growth has fallen below expectations and this is in spite of a massive QE program being pursued by the Bank of Japan.
  • From an economic cycle perspective it has been some time that the U.S. economic cycle has been out of sync with foreign economies. The Fed wants to increase rates if for no other reason than to have fire power available if needed down the road. Many developed overseas markets, especially the euro zone, have just recently embarked on a QE strategy in an effort to stimulate growth. This will keep euro zone interest rates down at a time the Fed is trying to move our rates higher. This would result in a further strengthening of the US Dollar versus the Euro. A strengthening Dollar will continue to pressure multinational company earnings/sales.
  • The laser focus on the Fed's rate policy is also creating market uncertainty. We do not see specific economic data points that suggest the Fed should increase rates. The corner the Fed is in at the moment is the fact rates should have never been left this low for this long. The sooner the rate increase occurs, probably the better for the market looking 12-months out.
The sideways action for the markets for the better part of this year has culminated in quite a bit of technical damage to a broad basket of stocks and the indices themselves. Repairing this technical damage does not occur overnight. On the other hand, many individual stocks are in bear market territory and maybe this week's market action provides an opportunity to begin deploying excess cash. It is difficult to predict market bottoms though.


Wednesday, August 19, 2015

High Beta Underperforming Low Volatility

As the market continues to trade sideways in its, seemingly, directionless trade, it is helpful to observe various intermarket relationships and technical indicators to see what exactly is driving returns and to check-up on the overall health of the market.  One interesting dynamic of the market this year is the underperformance of high beta stocks in relation to low volatility stocks.  In a typical bull market, high beta stocks outperform as market psychology shifts to a “risk on” mindset where cyclical companies (such as high beta and high growth stocks) are favored over non-cyclical companies that provide lower, more protected exposure.  This has not been the case this year.  High beta stocks have underperformed low volatility stocks measured by the ratio of the performance of the S&P 500 High Beta ETF (SPHB) over the S&P 500 Low Volatility ETF (SPLV).   As the ratio moves higher, high beta is outperforming low volatility and as the ratio moves lower, low volatility is outperforming high beta.

From The Blog of HORAN Capital Advisors

The performance dispersion can partially be explained by the difference in sector weighting of these two ETFs.  Given SPHB's high beta, cyclical tilt, overweights in Energy and Industrials have been a big drag on performance.  Conversely, SPLV has no Energy exposure and higher weightings to Consumer Staples and Health Care, two sectors that traditionally carry lower volatility and have outperformed the broader market this year. These are a few examples of why the low volatility strategy is outperforming not only high beta names this year, but has also caught up to the S&P 500.

From The Blog of HORAN Capital Advisors

This being said, it is interesting to note that growth stocks are still outperforming value stocks in the same time period, shown by the relationship between the S&P 500 Growth ETF (IVW) and the S&P 500 Value ETF (IVE).

From The Blog of HORAN Capital Advisors

While this is not a new dynamic to this bull market,  the amplified disparity in performance since the end of June is noteworthy as investors continue to favor companies with higher growth rates in this slow, bump along environment. High beta stocks may reverse trend and outperform the low volatility strategy should the market resume a trend to new highs, but until then, low volatility is in play.


Tuesday, August 18, 2015

Some Market Technicals Looking More Bullish

When looking back to mid-October of last year, the S&P 500 Index has enjoyed a nice move higher from the mid October 2014 pullback: up 12.9%. However, since the beginning of March the S&P 500 Index has traded sideways within a range from around 2,044 to 2,130 and is down fractionally since March 2nd.

Since the October pullback, the Accumulation Distribution Line has manged to trend higher yet moving sideways since March. Since July though, the ADL is moving higher again. The full definition of the ADL can be found here, but contains a Money Flow Multiplier. Briefly, the StockCharts.com website contains the following summary,
"The Money Flow Multiplier fluctuates between +1 and -1. As such, it holds the key to the Money Flow Volume and the Accumulation Distribution Line. The multiplier is positive when the close is in the upper half of the high-low range and negative when in the lower half. This makes perfect sense. Buying pressure is stronger than selling pressure when prices close in the upper half of the period's range (and vice versa). The Accumulation Distribution Line rises when the multiplier is positive and falls when the multiplier is negative."
From The Blog of HORAN Capital Advisors

The On Balance Volume (OBV) indicator continues to trend lower and OBV adds a period's total volume when the close is up and subtracts it when the close is down. A cumulative total of this positive and negative volume flow forms the OBV line. The trend is important in this line as well and maybe the OBV is beginning to turn higher as well.

In summary, the rising ADL is an early indicator that the market may be nearing a bullish reversal. As the above shows, market volume on down days has been trending lower while volume on up days has been trending higher. There remains technical resistance to the upside; however, if the market can manage to continue making higher highs and higher lows, the S&P 500 Index may break to the upside and out of this protracted sideways trading range.


Friday, August 14, 2015

Market Volatility In Perspective

It seems easy to forget what equity returns were like following the financial crisis in 2009. The significance of the contraction has certainly remained forefront in investors' minds. Just looking at the below chart reminds one of the damage done to portfolio values through this time period. At its worse, the 1-year return for the S&P 500 Index was negative 48.8% looking back from March 5, 2009. Almost exactly one year later, the 1-year return for the S&P 500 was 68.6% as of March 9, 2010. This type of volatility is not what investors like to experience or expect.

From The Blog of HORAN Capital Advisors

Notable in the above chart is the fact the returns for the 1-year rolling periods is trending lower as can be seen on the chart between the red and green resistance and support lines above. We do believe there is a high probability that equity returns, over the next three or so years, will be more muted in the mid to high single digit range.  With this potentially lower return environment, all else being equal, lower market volatility could persist as has been the case for the past few years and noted below.

From The Blog of HORAN Capital Advisors

A part of this lower return expectation is the fact we do believe a more neutral Fed Funds rate might be lower than the neutral level historically. If a neutral Fed Funds Rate is in the 2 - 3% range, it is not a stretch to expect equity returns to be in the high single digits from an equity risk premium perspective.


Anticipating The Rate Hike

For historically good reasons investors get fixated around Federal Reserve policy changes that lead to changes in the direction of interest rates. These interest movements provide investors with insight into the Fed's perspective on the economy. In short, in an overheating economy, the Fed will push rates higher in an effort to contain potential inflationary pressures. In an economy that is weakening, the Fed lowers rates in order to establish an environment that will stimulate economic growth.

In the past we have written that an increase in interest rates is not necessarily a negative for stock returns. This has especially been the case when rates are increased at levels below 4%. The thinking is a rate increase at this time is the Fed's desire to get rates back to a more normal level to have a tool at their disposal in the event there is some type of economic shock to the system. When rates are increased beyond 4%, this generally is a signal by the Fed it desires to slow economic growth to contain inflationary pressures and this is the point in time that rate increases can be a negative for stock price returns.

So we sit here today and investors/strategists seem to have heartburn around an impending rate increase. However, as the two charts below show, stocks actually move higher in tandem with a rising Fed Funds Rate (yellow line).

From The Blog of HORAN Capital Advisors

From The Blog of HORAN Capital Advisors

Source: Andrew Todd

As the above chart does show, at the initial onset of a rate hike, the market does tend to be more volatile and trend lower for a brief period of time. Over the course of the cycle, however, the equity market is positively correlated to the higher rate moves.

I do understand the concern about a rate hike at this point in time: emerging market slowdown, stronger dollar and its short term negative impact on exports, but, a rate hike of 25 basis points from this starting point should not have a huge negative impact to the market and the economy. The Fed should probably initiate the initial increase to remove investor fixation on this issue.


Thursday, August 13, 2015

Better Investing Members' Most Active Stocks As Of August 13, 2015

It has been several months since I last provided readers with an update on the most active stocks from Better Investing members. At the top of the list is Apple (AAPL) which has been a favorite of Better Investing members for a number of months running. New to the list since I list provided an update is Ambarella Inc. (AMBA), Southwest Airlines (LUV) and Starbucks (SBUX).

From The Blog of HORAN Capital Advisors

Disclosure: Firm long QCOM, AAPL


Thursday, August 06, 2015

Negative Investor Sentiment Abounds

The S&P 500 Index is down 2.2% from its late May high, up 1.2% year to date, and yet, up 9.1% over the last year and investors are becoming more concerned about an imminent correction in the stock market. The concern is certainly understandable given the fact the market is nearing four years since the last 10+% correction. This concern has translated into and equity put/call ratio that continues to rise towards levels indicative of an oversold market. An oversold market and only down 2.2%? The below chart shows the CBOE Equity P/C ratio closed at .82 today. Levels above 1.0 are most predictive of overly bearish sentiment and where markets have the propensity to rally.

From The Blog of HORAN Capital Advisors

Some market technicians prefer to look at the 21-day moving average of the equity put/call ratio to determine market sentiment. By this measure the ratio also is nearing a level indicative of an oversold market.

From The Blog of HORAN Capital Advisors

Lastly, today's report on individual investor sentiment from the American Association of Individual Investor shows bullish investor sentiment remains at a very low level, 24.32%. Today's sentiment reading remains more than one standard deviation below the average bullish sentiment level of 39%.

From The Blog of HORAN Capital Advisors

With all this negative sentiment as an undercurrent in the current market action this year, odds seem to favor, at worse, a continued sideways market trend and just possibly, a move higher from near these levels as we close out the last third of the year.

Tomorrow's job report is likely to be market moving for some reason; however, a report wildly above expectations is not expected. Wednesday's ADP Employment report indicated payrolls increased by 185,000 which was lower than the lowest estimate of 190,000. Consensus non-farm payrolls are expected to increase 212,000 with the low end of the range equaling 210,000. An increase above 300,000 is really what the this economy needs.


Tuesday, August 04, 2015

The Risk In Chasing Performance

One of the blogs I read on a regular basis is Ben Carlson's A Wealth of Common Sense. Ben's articles are written with a style that employs one of Albert Einstein's quotes, "If you can’t explain it to a six year old, you don’t understand it yourself." His latest article, Avoiding Process Drift, focuses on the vagaries of performance amongst the different investment styles, i.e., large growth, large value, small growth, etc. He notes in the opening paragraph of the article that investors are beginning to question the underperformance or outperformance of the varies investment approaches. Is it time to make a change in one's style allocation? He writes,
"Growth and momentum stocks are on fire this year, crushing their value counterparts, so of course investors are trying to figure out what it all means. The problem with looking at just the latest performance figures is that there’s no context involved. This type of thinking is how investors make mistakes."
Based on the below chart that shows performance as of the end of July, which style does one choose now?

From The Blog of HORAN Capital Advisors

Ben Carlson's article concludes that chasing a recent performance winning strategy has often been a losing strategy. His article contains performance figures noting the underperformance of "performance chasing" strategies.

The important factor for investors is to stick with a process as noted by Ben. Certainly, if ones process is not working over the longer run, i.e., more than just the seven months that have passed this year, adjusting one's approach would be appropriate. Reading Ben's entire article is a worthwhile read.


Sunday, August 02, 2015

Pursuing Low Quality Equities Has Been A Winning Strategy

For most of the market advance since the end of the financial crisis, low quality stocks have been the driver of equity returns. One factor that historically leads to outperformance for high quality stocks is increased market volatility. This higher volatility has certainly been absent for nearly four years and is evidenced by the lack of a 10% market correction since October 2011 and a low VIX level.

From The Blog of HORAN Capital Advisors

From a sector performance perspective, health care continues to lead the other market sectors over the one year and year-to-date time period. The laggards continue to be materials and industrials. These two sectors have been negatively impacted by the continued strength of the U.S. Dollar and weakness in the emerging markets.

From The Blog of HORAN Capital Advisors

From The Blog of HORAN Capital Advisors

The lack of strength in some of the cyclical sectors (materials and industrials) is partially attributable to the slow growth economy in the U.S., the strong dollar and weakness in emerging markets. Last week's GDP report continues to indicate below trend economic growth in the U.S. and a widening gap between actual and trend GDP growth. As the below chart shows, real economic growth since the end of the financial crisis has been half of the growth rate that was generated from 1950 through March 2009.

From The Blog of HORAN Capital Advisors

This slower pace of economic growth seems to have led some investors to gravitate to the more riskier segments of the market in light of overall lower market volatility. This has pushed equity valuations to slightly above average levels and has resulted in less margin of error for some of these growthier firms.


Thursday, July 30, 2015

Steep Drop In Bullish Investor Sentiment

Today's Sentiment Survey report by the American Association of Individual Investors shows bullish individual investor sentiment fell a steep 11.44 percentage points to a low 21.1%. The bull/bear spread is now -19.6%. The last time the bull/bear spread was at this level was the early part of 2013. For investors, this contrarian indicator suggests the market could be setting itself up for a move higher after trading sideways for the better part of this year.

From The Blog of HORAN Capital Advisors
Source: AAII


Monday, July 27, 2015

Equity Risk Premium In A Rising Interest Rate Environment

I have noted in several earlier posts over the years the importance investment professionals place on the equity risk premium (ERP). Although the ERP is one important factor to evaluate, there is quite a bit of disagreement on on how to appropriately calculate the premium. In short though, the ERP is the additional return above the risk free asset an investor requires to invest in stocks. For example, if an investor has a view that the market is under valued and likely to go higher, then one's view is the ERP will decline in the future. Conversely, if the investor has a view that the market is over valued and likely to go lower, then the investor believes the ERP will increase in the future. As the below chart shows, the ERP has declined significantly since late 2011 in conjunction with strong stock returns since the end of the financial crisis

From The Blog of HORAN Capital Advisors

Because the Fed in the U.S. and central banks around the globe have pushed  interest rates down to artificially low levels, this has caused investors' required absolute return on stocks to decline.

On Wednesday, the FOMC meeting announcement will take place around 2:00 p.m. There remains disagreement on when the Fed will raise short term rates, but if short term interest rates rise and cause a commensurate increase on the long end of the interest rate curve, this could place downward pressure on stock prices as the ERP is shifted lower. What can offset this narrowing of the ERP is strength in corporate earnings. However, earnings in Q2 2015 are estimated to decline around 3-4%. On the positive side, earnings comparisons are expected to improve in Q4 2015 and Q1 2016. This improvement in earnings growth is a result of companies lapping the headwinds from energy and the strong U.S. Dollar.

As the below charts show, in the short term, equity prices tend to decline at the onset of a rate hike by the Fed; however, the market tends to adjust and equities move higher over the rising rate cycle. We discussed this in a post early in 2014 titled, Rising Interest Rates Can Be Good For Stocks.

From The Blog of HORAN Capital Advisors

For investors interested in a more in depth review of the ERP, Aswath Damodaran, a professor at Stern School of Business at New York University, publishes a frequently updated paper on the various methods utilized in calculating the ERP.

At this point in time, if investors believe the Fed is very near starting to increase interest rates, stocks that could be impacted the most are the higher valuation equities and momentum stocks. It is these two types of equities that have attracted the most investor attention this year.


Saturday, July 25, 2015

Weakening Sentiment Negatively Impacting Consumer Spending

The IBD/TIPP Economic Optimism Index reported this month continues to indicate weak individual optimism. For July the IBD/TIPP Economic Optimism Index was below the neutral 50% level for the third consecutive month.

From The Blog of HORAN Capital Advisors


In addition to weakness seen in the TIPP Index, IBD notes, "the Six-Month Outlook Index fell for a third straight month, sinking 0.8 point to 44.5. That's the lowest since last September."

From The Blog of HORAN Capital Advisors
Source: IBD

In July, Confidence in Federal Economic Policies did increase three points to 44.2, but remains below the neutral 50% level. The TIPP Index is comprised of three components.
  • The Six-Month Economic Outlook: a measure of how consumers feel about the economy’s prospects in the next six months.
  • The Personal Financial Outlook: a measure of how Americans feel about their own finances in the next six months.
  • Confidence in Federal Economic Policies: a proprietary IBD/TIPP measure of views on how government economic policies are working.
The weakness seen in this sentiment measure has carried over into other sentiment reports. The  University of Michigan Consumer Sentiment Index reading, reported a week ago, fell to 93.3 versus the prior reading of 96.1. Econoday notes, "consumer sentiment has been running very strong most of this year and often well ahead of consumer spending readings which have been flat. But today's report (July 17th) suggests that the best for confidence may already have passed (emphasis added.)

The consumer sector seems to be more discerning in its spending resulting in a decline in the change in personal consumption expenditures and a commensurate increase in the savings rate (purple line in second chart below.)

From The Blog of HORAN Capital Advisors

From The Blog of HORAN Capital Advisors

A result of what seems like a pullback in consumer spending is business and retail inventory to sales ratios continue to increase. Some of this build is a result of an inventory build following the disruptive issues in the first quarter. However, with a slowdown in consumer spending and potential slowing in inventory build in the economy, these two factors will have negative implications for GDP growth in the second quarter.

Lastly, earnings reports for Q2 have, so far, exceeded analyst lowered expectations. Thomson Reuters notes through July 24th, 77% of companies have reported positive EPS surprises; however, only 52% have beat on revenue. The consumer seems to have weakened through the second quarter. With the consumer accounting for about 70% of economic activity, a more positive consumer will be needed to provide economic strength in the second half of the year. Oil prices seem to be taking another leg down with many commodities following suit. These lower energy prices should begin to show up in lower gasoline prices as well and may be necessary to stimulate consumer confidence and consumer spending.


Friday, July 24, 2015

Market Correcting Over Time By Trading Sideways Versus Steep Price Drop

Since February the S&P 500 Index has essentially traded sideways within a 4.8% trading range. This sideways market movement may be resulting in a trading pattern where the market is correcting over time versus correcting with a steep price drop. A sideways market correction enables earnings to catch up to the market's price. As the below chart shows, several of the technical indicators suggest the future market direction is one where the price could trade to the bottom of this trading range highlighted by the yellow box on the chart.

From The Blog of HORAN Capital Advisors

A closer view of the market, as provided by Charles Kirk of the The Kirk Report, shows there are three additional gaps the market may attempt to fill that will take the index level to the lower end of this trading range. His commentary included with his technical analysis notes,
"As shown in the chart [below], the S&P filled the first lower gap, tested and bounced from the 38.2 fibo, and then closed right at first support at the 50 day at S&P 2102. This is seen by many as an important support level that if not defended will soon bring the three other lower gaps into play as trade to targets."
From The Blog of HORAN Capital Advisors

One question is what factors will cause the market to trade to the upside and out of this trading range? One fundamental factor is that of company earnings growth. Recent earnings reports have generally beat analyst expectations, yet S&P 500 earnings growth for Q2 is expected to decline about 2%. Top line revenue results have been weaker than expectations in Q2, with companies citing headwinds from the stronger US Dollar. A positive is the energy and currency headwinds will begin to subside in Q3 and especially in Q4 and Q1 of 2016 as these headwinds are lapped in the year over year comparisons. In Q4 2015 and Q1 2016 earnings growth is expected to be about 4% and 9%, respectively. This better earnings growth could be a catalyst for higher equity prices beginning later in Q3 and into 2016.


Thursday, July 23, 2015

Neutral Sentiment Investors Are More Bearish Than Bullish this Week

An interesting facet of the American Associations of Individual Investors Sentiment Survey has been the recent long streak of an above 40% reading for the neutral sentiment category. This week represents a record 16th straight week with the neutral reading above 40%. Although the neutral reading remains high, this week it did fall from last week's 45.95% to 41.87%. More of these neutral investors have now become more bearish as the bearish sentiment reading increased 2.36 percentage points to 25.60%, whereas the bullish sentiment reading increased a lesser 1.73 percentage points to 32.54%.

As the below chart shows, bullish sentiments remains at a relatively low level, near 1 standard deviation below its long run average. Additionally, the second chart below shows the 8-period moving average of the bullish sentiment reading and it remains near its lowest level since the end of the financial crisis six years ago.

From The Blog of HORAN Capital Advisors

From The Blog of HORAN Capital Advisors
Data source for charts: AAII


Wednesday, July 22, 2015

Investor Letter Summer 2015: Countries/Territories Unable To Pay Their Debts

In our recently published Summer 2015 Investor Letter we highlight issues impacting the market in the first half of the year. In the second quarter the world was not short of market influencing events as Greece, China and Puerto Rico all dominated the headlines.  The second quarter proved to be another challenging quarter partially due to these events and volatility erased much of the year’s gains. However, U.S. economic data was certainly a bright spot as positive reports provide some optimism as we enter the second half of 2015.  Beginning in the third quarter, the headwind resulting from the strong US Dollar and energy weakness should begin to subside and make year over year comparisons more normalized.

Also, we welcomed two new employees to our investment team in the quarter:

Senior Portfolio Manager, Todd Poellein, CFA
Todd joins HORAN Capital Advisors with over 10 years of portfolio management experience and nearly 20 years of industry experience. Todd graduated from the Kelly School of Business at Indiana University and spent a number of years at PricewaterhouseCoopers and Fifth Third Bank. He holds the Chartered Financial Analyst (CFA) designation and will bring great value to our client relationships with his knowledge of portfolio construction, security analysis and long-term planning.

Investment Associate, Matthew Woebkenberg
Matt is a recent graduate of the University of Notre Dame where he carried high honors while majoring in Finance and Spanish. Matt is already pursuing his CFA designation and will take Level I this December. Matt will support the portfolio managers at HORAN Capital Advisors and we look forward to his contributions.

For additional insight into our views for the market and economy, one can read our Investor Letter accessible at the below link.
From The Blog of HORAN Capital Advisors


Monday, July 20, 2015

Weak Market Breadth But Equity Valuations Not Extended

Recent market commentary has highlighted the weak market breadth in spite of the equity market's continued move higher. Weak market breadth refers to the technical situation where more equity issues are declining than rising. This weakness raises a red flag in an environment where breadth is negative and the equity market continues to move higher. Below are a couple of charts and article links noting the weakness and subsequent returns when this occurred in the past.

From The Blog of HORAN Capital Advisors
Source: Dana Lyons

From The Blog of HORAN Capital Advisors
Source: Ryan Detrick

Certainly, the breadth technical picture is something investors should continue to evaluate. However, what is equally, if not more important, are company fundamentals and the valuation level of the overall market. Below are a couple of charts on two market sectors that have attracted a lot of investor attention this year.

The first chart compares the S&P GICS Technology Sector to the forward P/E for the 67 companies that currently make up the sector. As can be seen from the chart, valuations are no where near the sector valuation reach prior to the tech bubble bursting in 2000. In 2000 the PE reached nearly 50 for the sector where today the sector is trading at a PE multiple of just under 15 times earnings.

From The Blog of HORAN Capital Advisors

Another sector that continues to attract investor interest is biotechnology. As the below chart for this sector shows, the biotech index (8 companies) has risen significantly since 2012. In spite of this sustained move higher, the sector PE is just over 17, far below the 2000 peak of 63.

From The Blog of HORAN Capital Advisors

Lastly, even the broader S&P 500 Index itself is not trading at the technology bubble level reached in 2000. The current forward PE is 17 versus the 2000 peak of 24. The current PE is just slightly above its long term average.

From The Blog of HORAN Capital Advisors

The weak market breadth is a variable investors might want to track, keeping in mind market valuations are far below the levels reached in early 2000. A critical variable will be corporate earnings looking out for the next four quarters. Companies  have begun reporting their second quarter results (60 companies reported through 7/17). Earnings growth for the next four quarters is projected to back-end loaded. Thomson Reuters I/B/E/S is estimating Q2 2015 through Q1 2016 quarterly earnings growth will equal: -2%, -1%, 4% and 9%.

And finally, just a brief comment on individual investor sentiment, which we also review in our just completed Summer Investor Letter. AAII individual investor bullish sentiment was reported at 30.8% last week, which is nearly one standard deviation below the average bullish sentiment level. Two weeks ago the bullish sentiment reading fell to a low 22.6%. This low level of bullishness reported by individual investors is a contrarian indicator. Could the market be positioning itself for a rally to finish off the summer? Ryan Detrick wrote an article today, Investor Sentiment: Why A Market Correction May Be Slipping Away, that provides a good analysis of other sentiment indicators and what these indicators might suggest for market performance in the coming months.


Tuesday, July 14, 2015

Was Today's Twitter Buyout Hoax An Indication Of An Overvalued Market?

The Twitter (TWTR) buyout offer hoax this morning have some believing this is an indication the market is trading at an overbought level. The thinking is investors are taking trading positions based on rumors versus evaluating company facts and company fundamentals. Mark Hulbert, a senior columnist at MarketWatch and the editor of the Hulbert Financial Digest, published an article late this afternoon, Why the Twitter Hoax Suggests the Market is Near a Top.

In the article he notes, " ...investors are increasingly resorting to betting on rumors as they become unable to find stocks that represent genuine long-term value." Mark Hulbert may certainly be right in noting the market is at a top; however, and equally or more important is the analysis of specific stock and market fundamentals. Broadly, from a market perspective, the valuation or price earnings ratio (P/E) of the market, does not seem indicative of an extremely overvalued market. The excellent J.P. Morgan Guide to the Market, contains a P/E chart for the S&P 500 Index that shows the forward S&P 500 P/E is just above the long term average P/E going back to 1990. Other valuation measures detailed in the below chart also are not indicative of an extremely overvalued equity market. For sure though, the easy money seems to have been made since the end of the financial crisis over five years ago, in the U.S. anyway.

From The Blog of HORAN Capital Advisors

Other technical market indicators also seem to indicate the market is, at a minimum, in a short term oversold level and beginning to move to a higher level. As can be seen in the below chart, the S&P 500 Index has found support at its 200 day moving average and is beginning to move higher over the last three days. Also, the MACD and stochastic indicators have turned positive from oversold levels as well.

From The Blog of HORAN Capital Advisors

Lastly, the percentage of S&P 500 stocks trading above their 50 and 200 day moving averages recently reached levels indicative of a short term oversold market and are now moving to higher levels as the S&P 500 moves higher too.

From The Blog of HORAN Capital Advisors

From The Blog of HORAN Capital Advisors

In investing nothing is a certainty; however, the potential resolution (kick the can) of the Greece situation seems to have eased some of the near term anxiety of investors for the time being. As second quarter earnings season unfolds, a potemntially clearer picture on the business environment will be forthcoming.


Thursday, July 02, 2015

Sharp Decline In Investor Sentiment

The American Association of Individual Investor's sentiment survey release this morning shows bullish sentiment fell nearly thirteen percentage points to 22.6% The previous week bulls switched to the bearish camp with bearish sentiment increasing 13.4%. The bull/bear spread is now -12.5%. As a reminder, this contrarian sentiment measure can be volatile from week to week and is most predictive at its extremes.

From The Blog of HORAN Capital Advisors
Source: AAII


Monday, June 29, 2015

Equity Put/Call Ratio Jumps To Near 1.0

It seems as though the Greece situation has been one that has been ongoing for years and was the cause for today's market decline and jump in the equity put/call ratio to .94 from .54 on Friday. As we noted in a May post in 2012, a spike in the put/call ratio to .99 was partly caused by "the lack of confidence in Europe handling its sovereign debt issues." Nearly three years later the same issues are again challenging investors. For investors, the equity put/call ratio...:
...measures the sentiment of the individual investor by dividing put volume by call volume. At the extremes, this particular measure is a contrarian one; hence, P/C ratios above 1.0 signal overly bearish sentiment from the individual investor.
From The Blog of HORAN Capital Advisors

When countries live and spend beyond their means, an unlimited supply of funding eventually drys up. The contagion concern is associated with countries like Spain, Portugal and Italy. In the U.S. Puerto Rico has now become an issue and broadly, the U.S. is living far beyond its means which needs to be addressed sooner versus later.

In the near term though, the markets sometimes become disconnected and sentiment does suggest an overly bearish investor when looking at the put/call ratio. Other individual investor sentiment measures also are bearish (AAII bullish sentiment.) Overly pessimistic sentiment indicators are contrarian indicators and are indicative of potential market bounces. 


Sunday, June 28, 2015

Equity Market Performance Around Crisis Events

With Greece headlines dominating news stories over this past weekend, investors might be on edge regarding future equity market returns on Monday and the coming weeks. A number of headlines this evening are using the words plunge and slide as U.S. futures are down less than 1.5%. Yes, much can change before the U.S. markets open Monday morning, but it is the sensational headline that generates reader clicks and article views. I have written several times over the past few years about these shocks to the equity market and how the market damage generally has been short lived, (here and here.)

S&P Dow Jones Indices published a report in September 2013, Shocks & Stocks, that analyzed market shocks and the initial market decline and the time necessary to recover the losses. Included in the report is the below table.

From The Blog of HORAN Capital Advisors

As can be seen in the above table, of the fourteen shock events listed, the average market decline was 5.3% and losses were recovered in an average of 14 days. Several of the losses were much greater than the average and the recovery time period much larger than the average. S&P notes though,
  • "Granted, even though selected events took much longer to play out than the medians would suggest, these extreme situations usually occurred within the confines of a long-term bear market and did not precipitate the initial decline. Examples of these include: 1) Pearl Harbor, 2) President Nixon’s resignation, 3) the terrorist attacks on 9/11, and 4) the collapse of Lehman Brothers. So should history repeat itself, and there is no guarantee it will, unanticipated events that occur within bull markets that throw markets for a loop are typically assessed for their economic impact in short order, allowing opportunistic traders to step in and quickly push share prices back to break-even and beyond."
A a word of caution for investors wishing to sell stocks early Monday morning, remember, these crisis events generally have a short lived impact on the return in equity indices.


Thursday, June 25, 2015

Companies Continue To Enhance Earnings Per Share Via Stock Buybacks

S&P Dow Jones Indices released first quarter 2015 buyback detail for the S&P 500 Index. On a year over year basis, buybacks declined 9.5%. In conjunction with the YOY decline in buybacks, YOY operating earnings declined 6.3% and as reported earnings declined nearly 13%. Important in the buyback report is the fact 20% of S&P 500 companies reduced their share count by at least 4%. This share count reduction enhances reported earnings per share and investors need to be aware of the artificial growth in EPS that results from this activity.
From The Blog of HORAN Capital Advisors


Saturday, June 20, 2015

Better Investing Members' Most Active Stocks As Of June 20, 2015

Better Investing Magazine maintains a list of most active stocks as reported by their members. From time to time I highlight recent activity. Below is the list of most active stocks as of June 20, 2015. Most of the active stocks on the list are experiencing more buying than selling. Two issues, Qualcomm (QCOM) and Ford (F), are experiencing the most selling pressure as reported by BI's members.

From The Blog of HORAN Capital Advisors


Disclosure: firm zand family long AAPL, QCOM


EURO STOXX 50 VIX At Record Wide Spread Versus S&P 500 VIX

The VIX index is a measure of volatility and a higher VIX reading is associated heightened investor fear. Because this index is know as the fear index, a higher VIX reading is viewed as a contrarian indicator. In late 2008 the VIX hit a level of near 90% as compared to today's reading of about 14%. Shortly after this high reading the S&P 500 Index reached a bottom and has been on a march higher since.

VIX measures are available for other markets outside the U.S. and one getting some attention at the moment is the EURO STOXX 50 VIX. As the below chart shows the VIX for the EURO STOXX Index has widened to a historically wide level versus the S&P VIX. This widening is likely the result of concern around the consequences of the resolution of the issues in Greece issues and the potential impact on European markets.

From The Blog of HORAN Capital Advisors

As can be seen in the above chart, the average spread between the VIX and EURO STOXX VIX is 3.78% and the current spread is 14.95%. The current reading places this spread difference in the 99 percentile over the last ten years.

For investors then, the question becomes how this spread differential gets resolved. Is the ultimate resolution in Greece a "kick the can" one which is likely viewed favorably by the market or is the future path one where Greece is removed from the Euro Zone? Can Hui, CFA wrote an insightful article covering potential outcomes for Greece and how investors can take advantage of the results in an article titled, Two ways to Play Greece. One important distinction for readers in the article is the two ways to play the Greece situation depends on whether one is a trader or an investor. 


Tuesday, June 16, 2015

Stock Investors Should Hope 2015 Is A Repeat Of 2013

Market similarities comparing this year to 2013 are beginning to rise to the forefront of investors' minds. For equity investors, let's hope 2015 is a repeat of 2013. In 2013 the bond market experienced a "taper tantrum" as the Fed was preparing to end its quantitative easing programs. From early May 2013 to mid September the 10 year US Treasury yield rose from 1.7% to 2.9%. On an absolute basis, this is a significant rise in interest rates and caused bonds to selloff.. The iShares 20+ Year Treasury Bond ETF (TLT) fell over 17% from May 2013 to year end 2013.


Sunday, June 14, 2015

Dow Theory Has Many False Signals

One technical market indicator that has gained quite a bit of focus recently is the weakness in the transport index (IYT) relative to the Dow Jones Industrials Index (DJIA). Dow Theory suggests that underperformance in the transportation sector of the market is a precursor to broader weakness in the Dow index.

From The Blog of HORAN Capital Advisors


Saturday, June 13, 2015

Low Bullish Investor Sentiment Generally Leads To Strong Forward Returns For Stocks

This past week the American Association of Individual Investors reported bullish investor sentiment declined over seven percentage points to 20.04%. This is the lowest sentiment reading level since April 11, 2013 when bullish sentiment was reported at 19.31%.

From The Blog of HORAN Capital Advisors
Data source: AAII


Monday, June 08, 2015

High Quality Stocks Hold Up Better In Broad Equity Market Corrections

Just two weeks ago I wrote an article focusing on investment risk and market corrections, Incurring Investment Risk Near A Market Correction. The "correction" thinking seems to remain high on many investors' and strategists' minds. From a contrarian perspective, market corrections are difficult to time and corrections rarely occur when everyone expects them to. This article is falling into the same line of correction thinking, maybe a trap of sorts; however, the following thoughts will touch on an equity strategy that historically has held up better in declining equity market environments.