Tuesday, August 17, 2010

Business Activity Actually Strengthening

Today's release of the industrial production and capacity utilization data ("V-shaped" recoveries?") indicated an improvement in manufacturing activity. Industrial production rose to 93.4% and exceeded expectations of 93%. Although motor vehicle production was up 10%, the Federal Reserve release notes indicate:
...manufacturing production excluding motor vehicles and parts advanced 0.6 percent. The output of mines rose 0.9 percent, and the output of utilities increased 0.1 percent.
From The Blog of HORAN Capital Advisors

In addition to an improvement in industrial production, the Federal Reserve reported an increase in capacity utilization. Capacity utilization increased to 74.8% versus expectations of 74.5%.

From The Blog of HORAN Capital Advisors

The demand for truck drivers is on the increase with driver shortages now a reality. In essence, these trucks are not driving around empty and are supporting the distribution of more goods due to the improving economy. This improving anecdotal evidence seems to indicate an environment where the economy is improving.


Wednesday, August 11, 2010

Cisco Comments Indicative Of Economy That Is Just Bumping Along

Cisco's (CSCO) earnings release and comments after the market close is indicative of an economy that is just bumping along with weaker growth. See the August 2010 comment that Chambers today. The forecasting foresight of John Chambers during other significant economic turning points and pulled together by Reuters is outlined below.

I do believe we will be in this uncertain economic environment until there is more clarity on the regulatory and tax environment that is coming out of Washington. This may not be visible until November; however, the market is pretty good at predicting what the future holds and is likely to react a month or two in advance of November.
CHRONOLOGY-Cisco CEO John Chambers' comments on the economy
6:42 PM Eastern Daylight Time Aug 11, 2010

NEW YORK, Aug 11 (Reuters) - Cisco Systems Inc Chief Executive John Chambers said there was "unusual uncertainty" in the economy and gave a revenue forecast that was below Wall Street expectations, sending shares tumbling. Chambers, one of Silicon Valley's longest-serving executives, is considered a good reader of industry trends. He was one of the first executives to flag the impact of the financial meltdown on the technology sector in late 2007.

Here are some of Chambers' comments in recent years.

AUG 2007
"I have been in this business for 30 years ... It's the strongest global economy I have been a part of."

NOV 2007
Chambers warned of "dramatic decreases" in orders from U.S. banks.

FEB 2008
Chambers said orders slowed rapidly from December to January in the United States and Europe. "It's the most cautious I've seen CEOs in the U.S. and Europe in many years."

MAY 2009
On customer sentiment: "You can call it stability, you can call it leveling out ... for the first time many of them feel something solid beneath their feet as opposed to going into deeper and deeper water."

FEB 2010
"In our opinion Q2 marked the second phase of the recovery with additional across-the-board acceleration -- in other words, balance across the board -- in all of our geographies and market segments."

MAY 2010
"Given all the uncertainties regarding the strength and shape of the recovery, concerns about the recovery possibly slowing and the unknown extent of job creation, we encourage you to wait for additional economic data before becoming too optimistic."

AUGUST 2010
"We are seeing a large number of mixed signals in both the market and from our customers' expectations, and we think the words 'unusual uncertainty' are an accurate description of what is occurring."
In this environment, equity investors should focus on higher quality companies that have strong cash flow and lower debt levels. Many of these companies pay growing dividends and hold up better during down market periods.


Tuesday, August 10, 2010

Wholesale Inventory to Sales Ratio Near All Time Low

One area businesses have focused on is not getting stuck with high inventory levels in the event the economy takes a double dip. At this point in time, at HORAN, we are not in the double dip camp.

As the below chart details, the wholesale inventory to sales ratio is near a record low at 1.15:1.

From HORAN Capital Advisors

If we continue to see an improving trend in consumer sentiment, sales activity would likely improve.

From HORAN Capital Advisors

This higher demand on inventory at a time when inventories have been reduced may lead to upward pressure on selling prices. Today it was noted that Wal-Mart (WMT) has been raising prices by an average of 6% in some markets. The company cites lower sales as the reason; however, one wonders if tight supplies are driving the pricing decision as well.

On Friday retail sales and business inventories will be released. Business inventories are expected to increase .2% and retail sales are expected to be higher by .5%. This would result in a decline in the business inventory to retail sales ratio. The detailed report can be found on the U.S. Census Bureau/Department of Commerce website.


Sunday, August 08, 2010

Earnings In Q2 Still Strong, Forward PEG Less Than 1.0

Earnings for the S&P 500 Index in the second quarter continue to exceed expectations.

From HORAN Capital Advisors
According to Thomson,
  • Of the 443 companies in the S&P 500 that have reported earnings to date for Q2 2010, 75% have reported earnings above analyst expectations.
  • The blended earnings growth rate for the S&P 500 for Q2 2010 is 38%.
  • The forward four-quarter (Q3 2010 – Q2 2011) P/E ratio for the S&P 500 is 12.7, below the average forward four-quarter P/E ratio of the previous 52 weeks (14.2).
From HORAN Capital Advisors

The forward PE to earnings growth rate (PEG) for the S&P 500 Index is .77. This is arrived at by calculating the earnings growth rate from CY 2010 to CY 2011 and dividing the result into the estimated CY 2011 P/E of 11.7.


Saturday, August 07, 2010

Emotions Can Lead To Poor Investment Returns

Benjamin Graham, often referred to as the father of value investing, once said,
"Individuals who cannot master their emotions are ill-suited to profit from the investment process."
Graham's quote was alluding to the fact that individual investors tend to make incorrect investment decisions when they let their emotions overtake investment discipline. Behavioral finance has shown that investors have a much stronger preference for avoiding investment losses than they do investment gains. As a result, this bias against losses causes investors to sell an investment after the investment has already incurred substantial loss. A recent article in the Financial Analyst Journal, titled Relative Sentiment and Stock Returns ($), provides research supporting this conclusion.

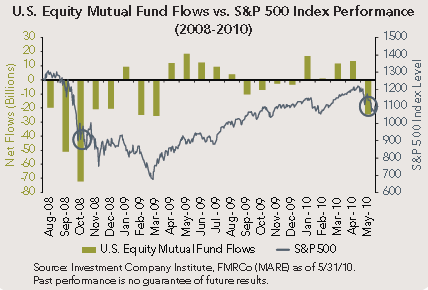
The below chart details mutual fund equity flows relative to the performance of the S&P 500 Index. As the chart shows, equity outflows are at their greatest near the bottom of market cycles.

From The Blog of HORAN Capital Advisors

The impact on investors' investment returns due to this behavioral bias is lower overall investment returns. During the height of the financial crisis in late 2008 and through 2010, investors who maintained their exposure to stocks through the crisis have generated a higher level of return than those who sold all their stocks and stayed out of the market or those that sold all of their stocks and jumped back into the market.

From The Blog of HORAN Capital Advisors

Because of the tendency for individual investors to let emotions influence investment decisions, at HORAN we review various sources of sentiment data on an ongoing basis. In last week's individual investor sentiment report released by the American Association of Individual Investors, it shows bullish sentiment fell over nine percentage points to 30.4%. Bearish sentiment increased to 38.2% versus the prior week's bearishness level of 33.3%. A result is the bull/bear spread was reported at -7.9% versus the prior week's spread of 6.7%.

From The Blog of HORAN Capital Advisors
In concluding, investors should use this behavioral knowledge to review ones appropriate asset allocation and risk tolerance. Additionally, investment decisions should be grounded in a disciplined process to reduce the likelihood of making decisions that can harm overall investment returns. Also, choosing an investment approach that has its foundation built on lower volatility, especially in down markets, can reduce the feelings that influence ones emotions during volatile market periods.

Source:

Defending Your Investment Brain
Market Analysis, Research & Education
Fidelity Management & Research Company
July 29, 2010
http://personal.fidelity.com/products/funds/content/pdf/defending_your_investment_brain.pdf


Tuesday, August 03, 2010

Dividend Payers Achieve Strong Performance Through July

The dividend payers in the S&P 500 Index continue to generate strong performance through the month of July. On a year to date basis the payers are outperforming the non-payers 4.53% to 1.46%, respectively. For the 12-month period the payers are outperforming both the non-payers and the S&P 500 Index.

The payer/non-payer performance is calculated on an average basis while the S&P returns in the below table are on a weighted basis. As noted in an earlier post, equal weighted holdings in the S&P Index have outperformed the market cap weighted holdings. This seems to be playing out with the dividend payers as well.

From The Blog of HORAN Capital Advisors


Saturday, July 31, 2010

Equal Weighting Stocks In Ones Portfolio Might Lead To Higher Returns

In January 2003 Standard and Poor's began tracking an equal weighted S&P 500 Index versus the traditional market cap weighted S&P 500 Index. In the short seven year period, the equal weighted index (EWI) has outperformed the market cap weighted S&P 500 Index.

From HORAN Capital Advisors
To market research theorist, this seems like an odd outcome as it does not conform to the capital asset pricing model (CAPM) or Efficient Market Hypothesis (EMH). So what does CAPM and EMH imply?

According to a recent S&P report that evaluated the performance of the equal weighted and market cap weighted indices, they provide the following summary of EMH and CAPM.
The theoretical underpinnings for market capitalization weighted indices as a basis for investment lie in the Capital Asset Pricing Model (CAPM) and the Efficient Market Hypothesis.

According to the CAPM model, the expected return implicit in the price of a stock should be commensurate with the risk of that stock. However, stocks are subject to two types of risk – systematic risk, resulting from potential movements in market factors; and unsystematic risks, resulting from factors associated with individual assets. Since unsystematic risk can be diversified away, stocks should be priced solely based on systematic risk. This also implies that it is optimal to hold a well diversified portfolio in order to minimize unsystematic risk for a given level of expected return.

According to the efficient market hypothesis, it is impossible to beat the market because prices already incorporate all relevant information. Based on this, the most efficient portfolio would be the entire market and a broad market capitalization index would represent the optimal investment. However, there is much debate as to how efficient the market is in practice. Thus, there are countless different strategies being used in an attempt to beat the market. This has led to indices created based on alternative factors that measure different strategies.
In addition to the question with EMH, there are questions surrounding Modern Portfolio Theory as well. I discussed issues with MPT in an earlier post titled, Modern Portfolio Theory: Is It Over Relied On?

Recent S&P research suggests the EWI outperformance is attributable to a couple of factors. The two prominent ones are size and style. As the below graphic shows, the EWI tends to have more exposure to the mid size companies in the S&P index as well as being more tilted towards value style companies. If one reviews Ibbotson data, the best performing asset class over the long run has been midcap value. As the performance table above shows, the larger sized S&P 100 Index has underperformed the cap weighted and equal weighted S&P 500 Index.

From HORAN Capital Advisors
In conclusion, the equal weighting in the indices has provided an investor with superior returns compared to the market cap weighted indices. Investors should read the entire S&P report as it shows this higher return comes with higher volatility. Additionally, the equal weighted indices have much higher turnover (rebalanced quarterly) in order to maintain the equal weighting of the underlying holdings. This higher turnover level is likely to lead to higher capital gains being realized. And lastly, given the higher volatility in the market today and likely into the foreseeable future, an investment portfolio that has more funds allocated to larger, generally higher quality companies, should hold up better in down market environments.

Source:

Equal Weight Indexing
Standard & Poor's
July 2010
http://tinyurl.com/24hshfn


Earnings Better Than Expectations and Revenues In Line

As the below graphic details, earnings have certainly improved compared to the end of the first quarter (first third of chart).

From HORAN Capital Advisors
According to Thomson Reuters, of the 336 S&P 500 companies that have reported earnings through the end of July, 75% have reported earnings above expectations. In a typical quarter since 1994, 62% of companies have beat expectations.

The market seems focused not only on earnings but on revenues as well. It is true revenues do drive earnings so long as sales are not generated by steep discounting resulting in slim or no gross margins. Again, according to Thomson Reuters, of these 336 companies, 64% reported revenues above analyst expectations, 0% reported revenues in line with analyst expectations, and 36% reported revenues below analyst expectations. Over the past four quarters, 61% of companies beat the estimates, 0% matched and 39% missed estimates. In the aggregate, companies are reporting revenues that are equal to estimates.

One factor to keep an eye on is the preannouncement ratio. For Q3 2010, 46 companies have provided negative earnings guidance while 15 have provided positive guidance. This equates to a negative/positive preannouncement ratio of 3.1. The N/P ratio for Q3 is above the long term N/P ratio of 2.1 for the S&P 500 Index.

From HORAN Capital Advisors


Tuesday, July 27, 2010

Norfolk Southern's Earnings Support Improving Economic Picture

After the market close today, Norfolk Southern (NSC) reported earnings (PDF) that increased 58.7%. The earnings of $1.04 per share bettered year ago results of 66 cents per share. Additionally, the results were 5 cents higher than analyst expectations of 99 cents per share.

Revenue increased 30.9% to $2.4 billion. During the company's conference call tonight, NSC noted, "effectively, all T&E employees have been returned from furlough status and we've started hiring in areas where traffic levels dictate and based upon expected attrition." Lastly, NSC announced a 6% increase in the company's third quarter dividend to 36 cents per share versus 34 cents per share in the same quarter last year.

From HORAN Capital Advisors

Both FedEx (FDX) yesterday and United Parcel Service (UPS) last week, cited an improving business environment as reasons to raise their outlooks. Other rail companies have reported this earnings season that their business conditions are improving.

These reports are certainly positive signs for the economy. Worries still remain with high unemployment and government and municipal debt issues though. In the end, all the news is not bad and investors can selectively find attractive investments in the current market.

Disclosure: Our firm is long NSC


Indexing Concerns And The Second Derivative Make This A Stock Pickers Market

One issue confronting investors at this point in the market cycle is the fact the growth rate of earnings on the S&P 500 Index are anticipated to slow going into 2011. Although operating earnings for the S&P 500 Index are projected to reach $92.19 per share, this level of earnings represents a lower rate of increase (the second derivative) than the earnings growth achieved in 2010.

From The Blog of HORAN Capital Advisors

For 2010 it is estimated that earnings will go from a -5% rate of growth in 2009 to a 22% growth rate in 2010. This represents a 27 percentage point positive swing in the rate of change in the increase in earnings on a year over year basis. It could be said the market's strong return in 2009 was forecasting this positive earnings change. The market does tend to be a good predictor of the future. As we now sit at mid year 2010, what are the estimated earnings for the S&P 500 Index in 2011 and what can be inferred from these estimates?

Although estimates show near record earnings of $92.19 for 2011 and a 16% increase over 2010 earnings of $79.53, this rate of growth is 6 percentage points lower than the estimated change in the growth rate of 27% in 2010. In other words, the second derivative of the earnings increase for 2011, or rate of change, is a negative 6%. Therefore, what investment strategy should investors pursue at this point in the market's cycle?

At HORAN Capital Advisors, we believe indexed large cap stock investors could be caught in this trading range cycle due to the negative second derivative of earnings, i.e. a negative rate of change in the growth rate. As a result, investors will likely achieve better returns, with less volatility, if they focus on individual high quality companies that exhibit a stable or consistent rate of growth in earnings when looking at earnings estimates for 2011 compared to the growth in earning for 2010. Those companies that can consistently growth earnings 10-15% over time are likely to provide investors with a more consistent return while assuming less downside risk as well. A couple of companies we own for our clients that satisfy this consistent or increasing growth criteria are Waste Management (WM) and Genuine Parts (GPC). As one can see by reviewing the below earnings charts, a steady or rising earnings per share growth rate is estimated for 2011. The 2011 EPS growth is near or better than the growth rate achieved in 2010. This represents just one of a number of variables we analyze, but it is certainly an important one.

From The Blog of HORAN Capital Advisors

One unpredictable variable is the market's potential reaction to the results of the midterm elections in November. What ever the election outcome, it could have a significant impact on sentiment for consumers and business.


Disclosure: Long GPC and WM


Thursday, July 22, 2010

Sentiment Swings From Bullish To Bearish

In this week's investor sentiment survey reported by the American Association of Individual Investors, bullish sentiment fell 7.2 percentage points to 32.16%. Bearish sentiment rose by a like amount to 45.03%. The 8-period moving average was reported at 33.2% and is still off of the YTD high reported earlier this year in the low 40% range. The bullish sentiment reading remains below the long term average of 39%.

From The Blog of HORAN Capital Advisors


Wednesday, July 21, 2010

Anxious Index

The Anxious Index is published by the Federal Reserve Bank of Philadelphia and refers to the probability of a decline in real GDP, as reported in the Survey of Professional Forecasters. The survey asks panelists to estimate the probability that real GDP will decline in the quarter in which the survey is taken and in each of the following four quarters. According to the Philly Fed the Anxious Index is the probability of a decline in real GDP in the quarter after a survey is taken. For example, in the survey taken in the second quarter of 2010, the anxious index is 9.81 percent, which means that forecasters believe there is a 9.81% chance that real GDP will decline in the third quarter of 2010.

From The Blog of HORAN Capital Advisors

In looking at the index over time beginning in the fourth quarter of 1968, the index often goes up just before recessions begin. For example, the first quarter survey of 2001 (taken in February) reported a 32% anxious index; the National Bureau of Economic Research subsequently declared the start of a recession in March 2001. The anxious index peaks during recessions, then declines when recovery seems near. For example, the index fell to 14 percent in the second quarter of 2002, when economic indicators began improving.


Monday, July 19, 2010

Is The Economy Rolling Over?

The economic data seems to be signaling a slowing of the economy; however, this slowing does not mean a double dip recession yet. Lackshman Achuthan of the Economic Cycle Research Institute noted in a recent Yahoo interview that we are experiencing a "sharp drop" in the weekly leading indicators. On the other hand the coincident indicator continues to show a sharp rise in economic activity.
Source: Briefing.com
One variable not included in the coincident measure and a part of the leading indicators is the direction of stock prices and stock prices have trended lower over the last three months; thus one component that is pulling down the leading indicator. Mark Thoma, a professor of economics at the University of Oregon, notes the relationship between capacity utilization and unemployment. In his article on his Economist's View website, he notes,
"In the past, there was a fairly close contemporaneous relationship between capacity utilization and unemployment. However, much like the relationship between output and unemployment, a lag in the relationship has developed in the last two recessions (see graph). That is, in past recessions an upturn in capacity utilization was matched by an upturn in employment, there was no delay in the relationship, but in recent recessions there has been about a half year delay before unemployment reacts to changes in capacity utilization (or perhaps even a bit longer)."
Thoma goes on to point out two favorable aspects of the above graph.
"First, the "V" in capacity utilization seems steeper than it was in the last two recessions. If the steep recovery of capacity utilization continues and employment follows, the recovery could be a bit faster than I've been anticipating (though the recovery of capacity utilization could certainly flatten out, and that possibility has to be factored into any policy response -- in the past two recessions the initial change in capacity utilization was also steep for the first few months, but it didn't last). Second, the lag between changes in capacity utilization and the change in employment appears to be shorter than the last two recessions. If so, then employment will recover faster. But the word "appears" here is important. Looking at the response of unemployment in the last (2001) recession, there were initial encouraging signs for unemployment just like this time, but then the recovery of unemployment stalled and actually increased a bit more before finally beginning to decline consistently. It's certainly possible that will happen again. Thus, while there are some encouraging signs here -- the steepness of the recovery for capacity utilization and the apparently shorter lag between improvements in capacity usage and improvements in employment -- but neither of these are unqualified, the steepness could change and the shorter lag isn't yet certain..."
The economic recovery we are experiencing is certainly fragile. Much of the support has been provided by the public sector and we need to see the private sector be more of a stimulus. Social, economic and tax policies coming out of Washington are creating potential headwinds. We continue to expect positive economic growth, although the growth is slowing at this time.


Sunday, July 18, 2010

Positioning For Higher Interest Rates

In a recent WealthTrack interview, conducted by Consuelo Mack, she talks with Loomis Sayles Bond Fund manager Dan Fuss. Dan Fuss is a two time winner of Morningstar’s Fixed Income Fund Manager of the Year award and has beaten the markets and its peers since the Loomis Sayles Bond Fund’s inception in 1991.

In the below interview, Dan Fuss provides insight into where he is finding value in the bond market. He also describes why he has recently shortened the average maturity of the bonds in the Loomis Sayles Bond Fund. Additionally, he talks about where he is finding value in the bond universe, which includes some global bond investments.

The lead in to the interview contains a performance comparison for treasury STRIPs and equity investments. The treasury investments have outperformed stocks for a very extended period of time. I do not believe the history of outperformance that is shown in the lead-in will repeat itself.


Saturday, July 17, 2010

Earnings In Second Quarter 2010 Better Than Expected

Earnings for the 2nd quarter of 2010 are coming in better than expected. A few facts noted by Thomson Reuters:
  • Through July 16, 48 companies in the S&P 500 Index have reported earnings for Q2 2010. Of these 48 companies, 75% reported earnings above analyst expectations, 13% reported earnings in line with analyst expectations and 13% reported earnings below analyst expectations. In a typical quarter (since 1994), 62% of companies beat estimates, 18% match and 20% miss estimates.
  • Over the past eight quarters, 69% of companies beat the estimates, 9% matched and 22% missed estimates. In the aggregate, companies are reporting earnings that are 16% above the estimates, which is above the 2% long-term (since 1994) average surprise factor and above the -1% surprise factor recorded over the past eight quarters.
From The Blog of HORAN Capital Advisors


Waning Consumer Confidence Hits The Market

One factor that contributed to the market's decline on Friday was the decline in the University of Michigan's Sentiment Index. The preliminary results came in at 66.5 versus expectations of 74.5. In prior posts I have noted how this index tends to lag the market's return by about 2-3 months. The recent market correction began in April and the consumer confidence index peaked in June.

(click for larger image)

From The Blog of HORAN Capital Advisors

Negative sentiment can translate into a negative impact on consumer spending as well.

From The Blog of HORAN Capital Advisors

It's not that the government can create jobs, but it can create an environment that translates into more confidence by consumers. The uncertainty created by the recent passage of a number of new policies and regulations is certainly negatively impacting consumer and business confidence. If the mid term elections result in a change in the party that has power in Congress, the market may view this as a positive and begin advancing prior to November. This is one factor that could lead to a more confident consumer.


Thursday, July 15, 2010

Second Quarter Investor Insight Letter

The second quarter of this year certainly presented noteworthy headlines, most of which led to downward market pressure. The S&P 500 Index ended down 11.43% and the 10-Year Treasury note rallied sharply as yields fell from 3.83% and settled below 3%, demonstrating a desire for less risky assets. Looking forward, if earnings expectations are met in Q3 and Q4 we believe the market has strong upside potential. Our letter this month will review Q2 and discuss market positioning and thoughts for the remainder of the year.

Read the complete Quarterly Investor Letter.


Thursday, July 08, 2010

Bear Attack

Today's individual investor sentiment survey released by the American Association of Individual Investors noted a 15 point increase in investor bearish sentiment. This survey measures investors' six month forward expectations for the market. Additionally, the bullish sentiment fell to 20.9% and is two points above the bullish sentiment reached in the week of March 5, 2009. Since this is a contrarian indicator, the low bullishness level is one technical measure that would be a positive sign for a future move higher in the market. This week's current gain of 4+% is certainly confirmation of this potential outcome.

From The Blog of HORAN Capital Advisors


Wednesday, July 07, 2010

Signs Are Not Pointing To A Double Dip Recession Yet

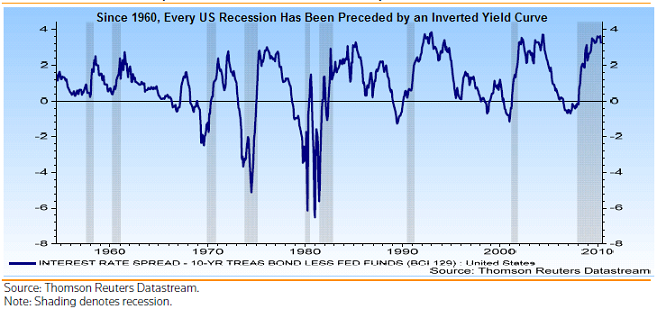
Since 1950 every US recession has been preceded by
  • A rise in interest rates
  • An inverting yield curve
  • Increasing oil prices, and
  • Falling unit profits for US nonfinancial companies
None of these factors have occurred as of today as the below charts detail.

No Rise In Rates:

From The Blog of HORAN Capital Advisors

Yield Curve Not Inverted:

From The Blog of HORAN Capital Advisors

Oil Prices Stable Last 12-Months:

From The Blog of HORAN Capital Advisors

Nonfinancial Corporate Profits Moving Significantly Higher:

From The Blog of HORAN Capital Advisors

So at the moment, a double dip recession does not seem to be the most probable outcome for the economy. We do not see the Fed tightening monetary policy at this point in time. The economic recovery is a fragile one so investors should not throw caution to the wind. We will be evaluating corporate earnings announcement and more importantly corporate earnings guidance for signs that an economic slowdown might be on the horizon.


Sunday, July 04, 2010

Dividend Payers Outperforming

For the month of June and the first six months of 2010, the dividend payers in the S&P 500 Index are outperforming the non-paying stocks. For the month, the payers' return of -5.91% was better than the non-payers' return of -7.30%. Additionally, this year the payers have declined 2.90% versus the non-payers decline of 4.41%.


On a year over year basis as of June, dividend payments were up 5.7%, for the quarter up 2.6% and down 3.2% on a year to date basis. In a further sign that companies view future prospects as improving, ten companies initiated dividends versus 65 that either decreased or suspended payments in the first six months of 2009.

dividend actions as of June 2010The two negative actions this year fell in the energy sector. Valero (VLO) decreased its dividend by 67% in January and Tesoro (TSO) suspended its 20 cent dividend in February.


Cash Likely To Reduce Overall Investment Returns

The past ten years have been difficult for investors given the extent of the market's volatility. During this time period it may seem that holding onto cash has been the proper investment decision. The question then becomes cash versus what other alternative. As the below chart notes though, on a calendar year basis, not once during the past ten years did cash outperform both stocks (S&P 500 Index) and bonds (BC Aggregate Index).

From The Blog of HORAN Capital Advisors

As a result there was a better investment alternative than sitting on cash if that cash was targeted for longer term investments. Holding some cash is perfectly logical if the cash is needed for short term needs. Since 1926 cash has outperformed equities and bonds in 12% of the calendar years covered.

From The Blog of HORAN Capital Advisors

Holding some cash can serve as a useful purpose in reducing ones overall investment volatility. However, holding too much cash can be a drag on an investor's overall returns.


Thursday, July 01, 2010

Individual Investors Certainly Not Bullish

Individual investor bullish sentiment declined over nine percentage points this week to 24.7%. This is the lowest bullishness level since November 5, 2009 when the bullish percentage was 22.2%. The 8-period moving average of the bullishness level fell for the sixth consecutive week to 35.1%. The 35.1% reading is the lowest bullishness average since the end of July last year when the 8-period average fell to 35%. The bull/bear spread for the week was reported at -17.3%.

From The Blog of HORAN Capital Advisors


Wednesday, June 30, 2010

The Market Does Track Earnings

If operating earnings for 2010 and 2011 come in as anticipated, the market is certainly likely to end the year at a level that is higher than where the S&P 500 Index closed today, 1,030. As the below chart notes, the market does track reported operating earnings.

Data Source: Standard & Poor's

After what has turned out to be a dismal second quarter for the market, many of the stocks in the S&P 500 Index are trading below their 50 day moving average. In fact, only 5% of the stocks are trading above their 50 day averages. This is a level that was last reached in mid May of this year and March of 2009. So on a short term basis the market certainly qualifies as being short term oversold.


The percentage of stocks trading above their 150 day moving average at the end of June (20%), is lower than the May 2010 level of 26%. This moving average declined to only 2% as of early March 2009. This could be one of those examples where the market can stay irrational longer than an investor can remain solvent.

From The Blog of HORAN Capital Advisors

For investors, company earnings reports for the second quarter, and more importantly, forward earnings guidance, will be critical in determining the direction of the market for the second half of the year. At this point in time at HORAN Capital Advisors, we are finding value in higher quality companies that are generating decent earnings and cash flow growth as well as trading at attractive valuations.

Economically, there are a number of positives that we will touch on in our second quarter newsletter. The two biggest negatives though are housing and employment.


Friday, June 25, 2010

Expect Market To Trade Within A Range

If history doesn't repeat itself perfectly, it often looks similar. As the below chart from Chart of the Day details, it is not uncommon for the market to trade within a range after a strong recovery off of a significant bear market. On top of this, the market tends to be choppy during the summer months. If the presidential election cycle market plays itself out, a better market environment may be upon us beginning in the fourth quarter and carrying over into early next year.


Investors can use this opportunity to build positions in higher quality companies that have pulled back in this market correction.


Wednesday, June 23, 2010

How Low Will New Home Sales Fall?


A Peak In The Leading Indicator Index Indicative Of Mid-Cycle Economic Phase

A number of strategists are citing the fact the economic leading indicators index is rolling over based on April's report and thus the economy is rolling over as well. Investors should note though that this is not an uncommon occurrence when the economy is moving into its mid cycle phase. A recent report from Fidelity provides a chart of the LEI versus the coincident indicator index.

"The number of leading indicators rising on a one-month basis fell significantly from seven out of 10 in March to four out of 10 in April (see Exhibit 3, right). On a more sustained six-month basis, eight out of 10 indicators rose in April—the same as the prior month. The declines on a one month basis were relatively small for all of the leading indicators except building permits, which fell 12% in April from the prior month--a sign of continued stress in the residential housing markets. However, continued strength on a six-month basis and mixed messages on a one-month basis could be indicative of the economy moving into the mid-cycle stage of economic recovery (emphasis added).

While leading indicators tend to rise in near unison immediately following recessions, interpreting them becomes more difficult as the economic recovery gains footing because these indicators tend to rattle around in a more volatile manner. The Conference Board combines these 10 leading indicators into a weighted Leading Economic Indicators (LEI) index that helps paint a broader picture than any one of its subcomponents. As an economic recovery develops, it is helpful to observe these leading indicators alongside other data to gauge a recovery’s strength. The Coincident Economic Indicators (CEI) Index, which helps to gauge current economic conditions as opposed to the leading nature of LEI, is suitable for this purpose."

Source:

Rising Corporate Confidence: Yet to Show Signs of Reversal
Market Analysis, Research & Education
A unit of Fidelity Management & Research Company
June 14, 2010
http://personal.fidelity.com/products/funds/content/pdf/yet_to_show_signs_of_reversal.pdf


Sunday, June 20, 2010

Where To Invest In An Inflationary Environment

Inflation has not been a threat to the economy or to asset prices in 2010. In fact, last week's CPI report contained hints of deflation with the seasonally adjusted CPI for May equal to the CPI reported in December. However, James Hamilton, professor of economics at the University of California San Diego notes in a recent article on inflation versus deflation,
"...my concern about long-run inflation comes not from the expansion of the Fed's balance sheet, but instead from worries about the ability of the U.S. government to fund its fiscal expenditures and debt-servicing obligations as we get another 5 or 10 years down the current path"
In the event inflation does take hold, what investments should an investor pursue to protect their assets? To answer that question an investor should determine whether they want to pursue an inflation hedge strategy or whether they desire an inflation protection strategy. The difference between an inflation hedge versus an inflation strategy is best summed up by Bill Ralls, CFA of Fidelity.
"In theory, a perfect inflation hedge would be an investment whose price moves in the same direction, at the same time, and by the same amount as changes in the consumer price index. Of course, there is no perfect inflation hedge, and while past performance is no guarantee of future success, some asset types have been more successful than others. For a successful hedging strategy, an investment’s return should increase at least as much as and at about the same time as the increase in inflation—or the time lag should at least be measured in months rather than years. Whereas building in protection against inflation over the long haul requires a more holistic approach and a consideration of what asset types have tended to do best in different inflationary environments."
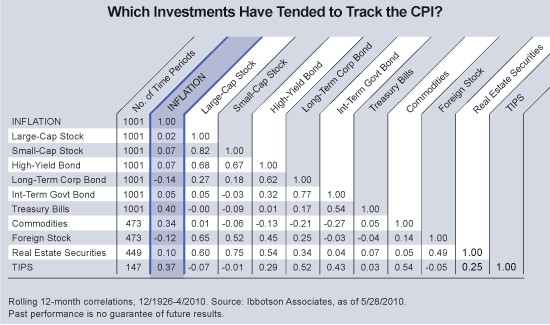
From a hedging perspective, Treasury Bills, TIPS and commodities have the highest correlation to CPI as detailed in the below table. A perfect hedge would have a correlation of 1.0.


Although commodities have one of the higher correlations, in periods of low inflation (Quintile 1 in the below table) the average 12-month rolling return for commodities is actually negative for all the rolling periods and commodities generated negative returns in 49% of the 12-month rolling periods evaluated.


In high inflation environments, Quitiles 4 & 5 above, commodities had the best 12-month rolling returns. Given the volatile nature of commodity prices, they still generated negative returns in 16% and 28% of the rolling periods.

As I noted in an article from a few years ago, Are Stocks A Good Hedge Against Inflation?, the important factor to consider is the direction of inflation. If the rate of inflation is slowing, i.e., increasing at a decreasing rate, the market is likely to view this as a positive for stocks. So in a high inflation environment, even stocks can be a good investment if the rate of change in inflation is negative.

The conclusion in my earlier article noted, "in these tough times in the market, stock price returns will be impacted by events happening in the future and not by those that have already occurred. From an emotional standpoint, it is easy to let ones feelings for future stock expectations get clouded by past events. Being able to overcome these past influences is important in achieving positive investment returns."

Source:

Inflation vs. deflation: Prepare for Either
Fidelity Viewpoints
By: Bill Ralls, CFA
June 2, 2010
https://news.fidelity.com/news/article.jhtml?guid=/FidelityNewsPage/pages/fidelity-prepare-for-inflation-or-deflation&topic=investing


Saturday, June 19, 2010

Is Gold's Bubble About To Burst?

Oppenheimer's chief investment strategist, Brian Belski, believes gold's price has reached bubble levels. In his recent research piece that was summarized in InvestmentNews, Belski states,
"...even on an inflation-adjusted basis, gold prices are higher now — two standard deviations above their long-term averages —than they've been since the early 1980s, when the U.S. was experiencing double-digit inflation. The metal is also “out of whack” with other commodities, a trend which has caused some puzzlement, even in places like the Federal Reserve."


Corporate Cash Levels Continue To Grow

Until several quarters ago, cash on corporate balance sheets remained at a fairly stable level. Recently though, companies have been growing cash balances. A recent Wall Street Journal article noted,
"...nonfinancial companies had socked away $1.84 trillion in cash and other liquid assets as of the end of March, up 26% from a year earlier and the largest-ever increase in records going back to 1952. Cash made up about 7% of all company assets, including factories and financial investments, the highest level since 1963."
As the two charts below note, cash has been increasing on an absolute dollar basis (first chart) and also as a percentage of a company's debt level (second chart). For S&P 500 companies, debt has grown by 5.6% over the past two years whicle cash has grown by 42.6%.


With a recent strengthening of the US Dollar versus the Euro and higher capital gain tax rates coming, US companies may use some of the cash to support corporate acquisitions both here and abroad. This same type of scenario played out when then president Reagan adjusted taxes in 1987. Additionally, given the level of cash, companies have the ability to step up dividend payments and dividend growth rates.

At the end of the day, this cash growth does show company business prospects have improved. No doubt corporate level expenses have been cut as well, but growth in revenue and earnings is occurring. I suspect this revenue and earnings growth will continue through year end and into 2011.


Thursday, June 17, 2010

HORAN Capital Advisor's Philosophy & Approach

The rules for successful investing do not change just because the environment has become more uncertain. At HORAN Capital Advisors, we believe investing begins by clearly defining one’s philosophy and approach. Managers who stray from their discipline tend to reach for market returns and ultimately get caught in short term situations that can produce negative outcomes. A thoughtful, repeatable approach that emphasizes high quality investments can navigate volatile markets and provide for sustainable long-term outperformance.

Attractive rates of return are achieved with dynamic asset allocation and a focus on high quality investments. Our philosophy emphasizes the importance of fundamentals and valuations. Investor euphoria and asset bubbles occur when fundamentals and valuations are ignored.; therefore, screening for high quality securities takes patience and a disciplined process. The capital markets always present opportunity and value is added when undervalued investments are purchased and overvalued ones are sold.

When we look at specific securities, the screening process must be clearly defined. For example, we approach individual equities by identifying criteria defined by a high quality approach. Companies must exhibit consistent growth, management strength, market dominance, and financial stability. Frequently, the byproduct of these metrics is a consistent dividend distribution. A company with the availability to grow its dividends is a sign of strong cash flow and profitability.

The world has become a different place over the past decade. Household wealth has seen significant variations leading to nervous investors. Volatility may likely remain as the world reacts to sovereign debt issues, geopolitical concerns, and policy changes. Patient investors will find opportunities to invest in securities that have attractive valuations and growth characteristics.

A strong and communicative client relationship enables us to establish an appropriate asset mix utilizing the global opportunity set. Our investment philosophy and core approach helps clients achieve their long-term goals and objectives.


Monday, June 14, 2010

The Market's Bear Case

John Hussman of the Hussman Funds notes in his weekly market commentary that all of the economic growth in this recovery has been fueled by the government's deficit spending. Hussman notes:
...if one removes the impact of deficit spending, "the economy has recovered to the point where the year-over-year growth rate since early 2009 now matches the worst performance of any of the 50 years preceding the recent downturn." In effect, Wall Street's is seeing "legs" where the economy is in fact walking on nothing but crutches.
Hussman's comment cites four variables he evaluates to determine whether we are in a recession or not. An update on the readings for these variables can be read in his weekly comment on the Hussman Funds website.

He does conclude, "From my perspective, the evidence isn't yet sufficient, from a probability standpoint, to firmly anticipate a double dip. But it is notable how close the evidence is to locking in on that conclusion."

Source:

Born on Third Base
Hussman Funds
by: John Hussman
June 14, 2010
http://www.hussman.net/wmc/wmc100614.htm


Contrarian Signs That Bull Market Phase Approaching

Media headlines are now proclaiming that Dow 10,000 is a barrier that may not be surpassed for several years to come. The cover of Bloomberg's June 14th Businessweek magazine features a bear with the article lead in:
"The bearish forecasters who rose to fame in the market crash of 2008 have, for the most part, not surrendered their pessimism. Their moment could be coming back around..."

Last week an issue of the Wall Street Journal featured an article titled, The 11-Year Itch: Still Stuck at Dow 10000, that was written by Jason Zweig. In that article it noted:
"Last week, the Dow Jones Industrial Average rose above 10000—again. Since March 16, 1999, when it first touched 10000 in intraday trading, the Dow has bounced over that threshold and back 63 times. This Friday (6/11/10), the index closed 219.6 points below where it stood exactly 11 years ago."
As the WSJ article notes, the Dow hit 1,000 for the first time in January 1966 and did not convincingly close above that level until December 1982. In November of 1963, with the Dow at 740, Ben Graham said:
"in my nearly 50 years of experience in Wall Street, I've found that I know less and less about what the stock market is going to do but I know more and more about what investors ought to do."
At the end of the day, one will not see the bull market coming, but all the bear market talk tends to be an indicator of a better market environment in the not too distant future.


Dividend Payments Likely To Improve?

As I have noted in past posts, 2009 was the worst year for dividends since the late 1950s. S&P reports that dividends on the S&P 500 Index fell 21%, which was the biggest decline since 1938. Even worse for investors was the fact that the higher quality dividend paying stocks lagged the broader market rebound in 2009 by returning 26% versus 65% for the S&P 500 Index. As Tom Huber, portfolio manager of T. Rowe Price's Dividend Growth Fund notes,
"A dividend-oriented strategy has to be looked at over market cycles—there are times when it will lag, typically coming off a market correction or recession, and times when it does relatively well, usually in periods of market turbulence."
Today, companies are in a position to once again focus on growing their dividends for several reasons.
  • Strong Balance Sheets: Many companies are flush with cash. A recent Wall Street journal article noted, "U.S. companies are holding more cash in the bank than at any point on record, underscoring persistent worries about financial markets and about the sustainability of the economic recovery. The Federal Reserve reported Thursday that nonfinancial companies had socked away $1.84 trillion in cash and other liquid assets as of the end of March, up 26% from a year earlier and the largest-ever increase in records going back to 1952. Cash made up about 7% of all company assets, including factories and financial investments, the highest level since 1963."
  • Sluggish Growth: In periods of slow economic and earnings growth dividends become a more critical part of the total return of a particular company's stock. In this environment companies are likely to respond to the investor's desire for more income from their equity investments. Since 1925, reinvested dividends have accounted for almost 44% of the total return of the S&P 500 Index.
  • Less Volatility: Dividend paying stocks tend to be less volatile during downside market volatility. One factor we believe that will be present in the investment markets for the foreseeable future is a more volatile investing climate. A recent T. Rowe Price report notes, "dividend-paying stocks in the S&P 500 outperformed nondividend payers in every bear market since 1973 but tended to lag in bull markets, according to Ned Davis Research (NDR), a market research firm.

    During the bear market from March 24, 2000, to October 9, 2002, the S&P 500 plummeted 49.1%, while the Dividend Aristocrats gained 15.5%, according to Strategas Research Partners, another market research firm. In the recent market decline from October 2007 to March 2009, the Aristocrats declined 49.6%, compared with 56.8% for the S&P 500."

  • Long-Term Performance: "NDR calculates that from 1972 through March 31, companies in the S&P 500 that have consistently increased or started making their dividend payouts provided an annualized return of 9.4%, compared with 7.3% for companies that paid dividends but did not increase them and only 1.5% for non-dividend-paying stocks."
  • Steady Cash Flow: "From 1980 through 2009, dividends on stocks in the S&P 500 grew at an annual compound rate of 4.7% compared with the 3.7% annual inflation rate."

    Over a longer time period, principal growth of an equity portfolio outpaces that of a fixed income portfolio as well. The T. Rowe Price article cites a Ned Davis Research study showing this performance difference.

    "NDR tracked the performance of two portfolios over the past 25 years. One consisted of the top 50% of dividend payers in the S&P 500. The other was the S&P Long-Term Government Bond Index. The study assumed all interest and dividend payments were taken in cash each year.

    Assuming a $500,000 initial investment in each portfolio at the end of 1984, the equity index provided total dividend payments of more than $2.6 million through 2009, or about $212,000 more than the total interest payments from the bonds. Moreover, in terms of principal value, the original $500,000 investment in the stock portfolio grew to more than $2.8 million compared with about $908,000 in the bond portfolio."

For an investor then, a resumption of dividend growth could be at hand. The stock prices of dividend growers will likely benefit from this growth as well.

If history plays itself out, outperformance of dividend payers, over the long run, is likely to continue.

Source:

Dividends, a Casualty of the Crisis, Poised for a Comeback? (pp12-13)
T. Rowe Price Report
Spring 2010
http://individual.troweprice.com/staticFiles/Retail/Shared/PDFs/Spring2010PriceReport.pdf


Monday, June 07, 2010

Market Still Short Term Oversold

Just because the market seems oversold, this does not mean it will move higher in the next day or week. I wrote a post on May 31st titled, Seems Like The Market Is Oversold. At that time the S&P 500 Index was trading at 1,089 and closed today at 1,050 or 3.5% lower than the 5/28 close.

What does seem to be the case though is the selling pressure is subsiding in spite of the late day sell off today. Trading volume on these down days continues to occur on successively lower volume days. Additionally, the percentage of stocks trading above their 50 and 150 day moving averages continues to decline. The percentage above their 50 day M.A. is not too far from the percentage reached in March of last year.


With this recent pullback, there are a number of high quality stocks that are trading at attractive valuations and yields. Investors might use this opportunity to initiate or add to these positions if they have cash set aside for equity purchases.


Sunday, June 06, 2010

Dividend Payers Trail Non Payers In May

The performance of the dividend paying stocks in the S&P 500 Index trailed the non payers in May by 1.34 percentage points. The payers returned -7.75% versus -6.41% for the non payers. On a year to date basis the payers have a slight edge, 3.20% to 3.11%, respectively.