
Thursday's release of the Conference Board's Leading Economic Indicators Index (LEI) shows an increase in the LEI for July of .5%. This reverses the declines in May and June. Importantly, and as the Conference Board release highlights, "While the LEI suggests the US economy will continue to expand in the second half of 2019, it is likely to do so at a moderate pace." Although a moderate expansion is expected, it is expansion nonetheless. The chart below shows the one year change in the LEI of 1.63%. Prior to previous recessions, the YoY change turned negative and this is not the case at this point in time.

Also, the below chart shows the diffusion index of the LEI at 55%. This means more than half of the ten components that comprise the LEI contributed positively to the LEI's July report. As can be seen on the below chart, prior to earlier recessions the diffusion index fell into a range of 20%-40%.

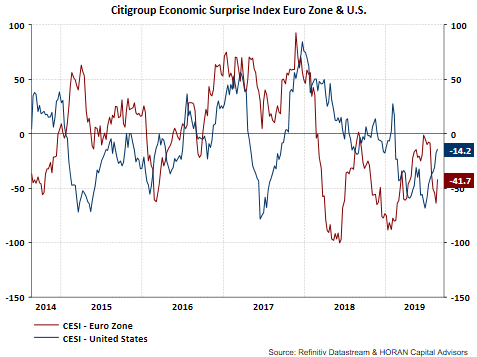
I have noted in earlier post that the Citigroup Economic Surprise Indices have little bearing on equity market performance. The Surprise Index does provide some insight into whether more of the economic data is exceeding economic expectations versus missing expectations though. Certainly the trend in the U.S. CESI is a positive one as fewer of its components are missing expectations.
It does seem nearly everyone's recession antenna is fully extended. The 2-year/10-year yield curve inverted again on Thursday on an intraday basis, yet closed slightly positive. Again, an inverted yield curve is one robust indicator that historically has been an indication a recession might begin about 12-36 months in the future. The 2/10 curve has not inverted on a closing basis this cycle.
One issue is the fact the recession conversation itself can alter consumer sentiment and result in the economy tipping into a recession. Many of the business and news programs over this past weekend focused their programs on the topic of a recession. Even the Google Trend search on the term 'recession' spiked this past weekend as seen below.

The difficulty with navigating the current market environment is the fact the economic data has been mixed. On the one hand, the manufacturing data seems to be indicating weakness ahead; however, the consumer data seems pretty good. Many recent retail earnings reports have been positive and retail brick and mortar stocks were so beaten down, their bounce on earnings was significant. It is hard to see a recession with a strong job market and a consumer that continues to spend money. Having noted this, one can read about reports of layoffs in industries like steel. Again mixed data.
Investors seem far from euphoric when looking at a number of the sentiment releases and the sentiment measures are contrarian ones. This week's Sentiment Survey release by the American Association of Individual Investors shows a slight improvement in bullish sentiment, yet the measure remains at a low level at 26.6% bullishness.

Some might say actions speak loader than words and from a sentiment perspective, they often go hand in hand. As the below chart shows, the top two panes reflect the sizable level of equity outflows from funds and ETFs. These equity fund/ETF outflows have found there way into bond funds. Given what appears to be an economy that is actually doing okay, and with interest rates so low, future bond returns could be challenged.

Certainly the mixed data picture can cloud the perspective on the future; however, the current economic releases do seem to be trending in a more favorable direction. The shape of the yield curve warrants paying attention to, but for now, the economy seems to be in a slowdown mode versus an economy headed into a recession.


No comments :
Post a Comment