Tuesday, April 26, 2011

First Quarter 2011 Investor Letter

First quarter corporate earnings results reported to date continue to be indicative of a sustained economic recovery. Our 1st Quarter Investor Letter provides our insight on the past quarter and a further look into 2011.

HORAN Capital Advisors' complete Investor Letter can be accessed at the following link: 1st Quarter Investor Letter.


Sunday, April 24, 2011

Invest In Emerging Markets Via High Quality Multinational Companies

In this week's WealthTrack video, Consuelo Mack talks with Jason Trennert of the research firm Strategas and Chuck Lahr, manager of PIMCO's Pathfinder World Fund (PATHX). Both are positive on the equity markets over the next 12-18 months. Chuck says the best value is in European companies that do business in the emerging markets. Jason favors high quality U.S. multinational companies that have dividend growth characteristics.


Thursday, April 21, 2011

The U.S. Government Deficit On An Unsustainable Path

The issue of the U.S. federal government's deficit has been a front and center issue over the course of the last several months. Congress' and the Obama administration's effort to reach an agreement on the FY 2011 federal budget touted the $38 billion reduction in spending. As the below chart shows, the current deficit stands at $1.4 trillion. Cutting $38 billion will have little impact on what ultimately needs to be accomplished. Even if revenues returned to levels in early 2008 (black line in below chart), the deficit would still be equal to about $900 billion. The widening gap between spending and receipts is an unsustainable one. The second chart details the rapid increase in the governments overall debt which has ballooned along with this widening gap between receipts and outlays.

From The Blog of HORAN Capital Advisors

From The Blog of HORAN Capital Advisors


Tuesday, April 19, 2011

Even A Little Inflation Is Dangerous

In the below video, James Grant of the Interest Rate Observer, provides an interesting interview with Consuelo Mack of WealthTrack. In the interview, Grant points to the dangers of even a little inflation and this policy's impact on inflating asset prices. He believes the Fed's policy of targeting a 2% inflation rate is misguided and provides his rational in the interview. Mr. Grant's views of the market come from the bearish perspective; however, investors are wise to look at the market from the perspective of both the bulls and the bears so as to have a well formulated view of the market.


Thursday, April 14, 2011

Sentiment Not Overly Bullish And Inverted Head and Shoulders Set Up

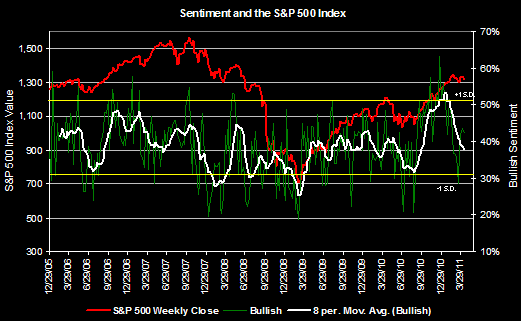
After the strong returns for the market in the first two months of the year, March appeared to served as a digestive phase for the market. Not surprisingly, since the beginning of March, the S&P 500 Index seems stuck in a trading range. From a pure technical perspective, the chart pattern that appears to be unfolding is a bullish inverted head and shoulders pattern. In order to complete this pattern, formation of the right shoulder is necessary with a sell off in the S&P 500 Index down to around 1,300. The market closed today at 1,314 so it is not far from this point. Additionally, a sell off with higher down volume would be positive as well. With tomorrow being an option expiration day, one could envision a higher volume down day occurring and completing the bottom of the right shoulder.

From The Blog of HORAN Capital Advisors

Individual investor sentiment does not seem overly bullish either, which is a positive contrarian indicator. This week's sentiment survey reported by the American Association of Individual Investors reported bullish sentiment of 42.2%. This is down 1.4% from last week's bullishness reading. As the below sentiment chart shows, individual investor bullish sentiment has not reached an extreme level. As an observation, these sentiment indicators tend to be most accurate at extreme levels.

From The Blog of HORAN Capital Advisors

In short, the market seems poised to move higher in a "climb the wall of worry phase". In July 2009, I discussed this wall of worry phase in a post, Where Are We In The Market Cycle that readers may find of interest.


Saturday, April 09, 2011

Buybacks Signaling Improved Business Confidence

Stock buybacks in 2010 came roaring back, increasing 117% over 2009 buybacks. According to Standard & Poor's Howard Silverblatt,
"Approximately $299 billion was spent by S&P 500 companies on share repurchases last year which represents a whopping 117% increase over the $138 billion spent in 2009. At this point the practice is not as deep as it was in the heydays of 2006-2007, but companies are certainly back in the buyback business. While 2010 expenditures are still just half of what was seen in 2007, last year’s activity resulted in a record year-over-year percentage and dollar increase for stock buybacks."
From The Blog of HORAN Capital Advisors

Below is a table highlighting companies that had significant buybacks last year.

From The Blog of HORAN Capital Advisors

Source:

S&P 500 Stock Buybacks Up 117% in 2010;Share Repurchases
Increase for the 6th Quarter in a Row

Standard & Poor's
By: Howard Silverblatt
March 23, 2011
http://tinyurl.com/3wsopb7

Disclosure: Long MSFT, XOM


Monday, April 04, 2011

Dividend Payers Underperforming Through First Quarter

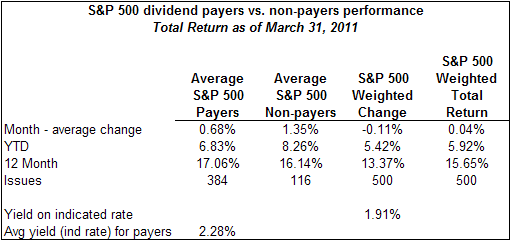
The equal weighted performance of the dividend payers in the S&P 500 Index trails the non payers through the first quarter of 2011, 6.83% versus 8.26%, respectively. For the 12-months though, the payers have a slight edge over the non payers, 17.06% versus 16.14%, respectively. The payers and non payers performance is calculated on an equal weighted basis and both are outperforming the market cap weighted S&P 500 Index for each of the time periods below.

From The Blog of HORAN Capital Advisors