From time to time I include technical chart information for stocks and indexes in blog posts. Primarily, I believe fundamental analysis is the most important type of research to perform in uncovering investment opportunities. Before making investments though, the technicals underlying particular stocks and/or indexes can be important in understanding the sentiment of the market or sentiment of investors. Following are a couple of links to articles describing the differences between technical and fundamental research:
Stock Market Technical Analysis Versus Fundamental Analysis, In Pictures
About halfway down the right hand column of the Alpha Global Investors website is a list of links to several articles on technical analysis under the heading: How to Chart Stocks.
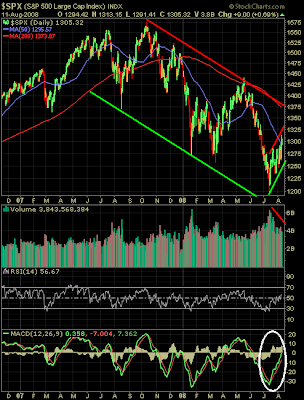
A quick look at today's market action for the S&P 500 Index indicates the price movement was bullish in the sense the index closed at 1,305 which is above the 50-day moving average of 1,295. This short term advance that began in early July continues to occur within a longer term down trend for the market. Additionally, the advance is occurring on increasingly lower volume. The market and chart would indicate the index wants to move up to the 200-day moving average, but high volume would lend more support.
(click on chart for larger image)

Time will provide the answer. There are several important consumer discretionary stock earnings reports this week. Tuesday, TJX Companies (TJX) reports earnings and Wal-Mart (WMT) reports on Thursday.
(I hold long positions in Wal-Mart and TJX Companies)

1 comment :
Thank you for referencing my post here! I appreciate the mention. I have never followed technical analysis while investing, though I remain curious about this entire area of study. I'll lurk around your site to get more info!
Post a Comment