Tuesday, July 31, 2007

Fortune Brands Increases Dividend 7.7%

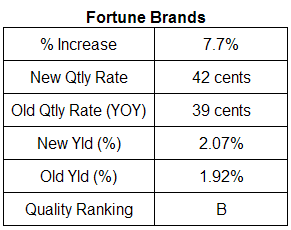
Fortune Brands (FO) announced a 7.7% increase in the company's third quarter cash dividend. The new quarterly dividend is 42 cents per share versus 39 cents per share in the same period last year. The payout ratio on the new annual dividend of $1.68 will be approximately 33%. This is based in 2007 estimated earnings of $5.13. FO is expected to earn $5.58 in 2008.

(click on table/chart for larger image)

Fortune Brands Dividend Table. July 2007
Fortune Brands Stock Chart. July 2007


An Investment Strategy For This Point In The Market Cycle

Last week's stock market performance was certainly one that tested the fortitude of stock investors. The unanswerable question is whether or not this is the beginning of a bear market or just another momentary setback for the equity bull market. At this point in time investors should review their broad asset allocation. Is there a portion of the equity portfolio that needs to be converted to cash within the next 12-18 months? Stock investments are a long term investment commitment, i.e., five plus year time horizon.

If the allocation between stocks, cash and bonds seems appropriate, what amount of fluctuation in equity values can one tolerate. If a lower volatility equity portfolio is desired, now could be the time to look at higher quality stock investments. Historically, large capitalization, high quality, dividend growth stocks held their value better in down markets.

Over the last five years, the better performing segment of the U.S. equity market has been small and mid capitalization equities. As noted in the charts below, although the small cap index (Russell 2000) has been one of the better performing segments of the U.S. equity market, it has been one of the worst performers year to date and last week. This is volatility.

(click on charts for larger image)

U.S. index performance chart YTD 2007
U.S. index performacne chart week 7/23/2007
One caveat is many strategist and investment professionals are telling investors a similar story. The result could be some downside equity returns as some investors find they need to take some money off the equity table. As long as the economic fundamentals remain in place, stocks should advance longer term--they have historically (see chart below of S&P 500 since 1950).

(click on chart for larger image)

S&P 500 chart since 1950


Sunday, July 29, 2007

Avoiding Dividend and Buyback Traps

Simply rushing to buy a stock because it has a high dividend yield or a company has announced a stock buyback will not guarantee an investor a nice total return. More often than not, a high dividend yielding stock is indicative of a company that has encountered a difficult operating environment. As the company's earnings prospects continue to languish, often times the company is forced to cut its dividend payment. Examples of this can be seen in company's like Pier 1 (PIR) and Kmart.

In an effort to avoid these types of companies, a recent article by The Motley Fool, highlighted three factors that should raise warning flags for an investor:
  • Erratic earnings: Companies with inconsistent or cyclical earnings have broken the hearts of dividend lovers many times over. When times are good, management teams at lumpy-earnings firms often fool themselves into believing the profits are here to stay, and they confidently raise their payouts accordingly.

    When the company's results revert back toward the mean, though, usually because cyclical firms often have little pricing power and their results are largely at the whim of uncontrollable market forces, management painfully discovers it has bitten off more than it can chew. Avoiding erratic earnings streams is step one for the dividend growth investor.

  • High or rising payout ratios: The same fat dividend that warms the heart of investors can sometimes give a company's management severe heartburn. Companies are loath to cut or suspend dividends even when that option, however ugly, is clearly the best move for the firm in the long haul. Managers know, with good reason, that dividend cuts and suspensions send the message that they do not think the firm will be able to maintain or continue growing earnings at a rate high enough to support their payout (emphasis added).

    It should be no surprise, then, that management is often willing to feign confidence by continuing to raise their payouts in the face of slowing or flat earnings growth...

  • Decelerating dividend growth rates: The last quick check also happens to be the first long-range sign that a long-growing company could fall flat on its face. Investors should take note when a company that has grown its dividend at a hearty clip over a multi-year period suddenly yanks back the reins and reduces the size of its dividend hikes.

    Now, there are plenty of reasons why such a move could make practical sense. The company could be shifting toward a policy of returning more money to investors through share repurchases, ramping up capital expenditures or research and development, or simply exhibiting prudent management.

Now what about stock buybacks. Generally, buybacks can be a positive indicator for a company's future prospects. However, as recently reported by Bloomberg:
While repurchases typically boost share prices, in the insurance industry, they're a sign that competition is pushing premiums low enough to threaten profit growth. Property and casualty stocks are lagging behind both life insurers and U.S. benchmarks as commercial insurance prices decline the most since they started falling in 2004.
The point is buybacks must be looked at from an industry perspective. As noted in the Bloomberg report:
The insurers buying stock wouldn't have to resort to repurchases if competitors weren't driving prices to potentially unprofitable levels, said Donald Light, an analyst at Celent LLC, a Boston-based financial research and consulting firm.

"Buybacks should limit price declines, but they're also a sign of falling prices,'' he said. "You don't think there's a lot of attractive new business when you're buying back your own shares."
When looking at dividends or buybacks, review past trends as well as historical industry practices before assuming all is well.

Source:
Avoid the Next Dividend Implosion
The Motley Fool
By: Joe Magyer
July 28, 2007
http://www.fool.com/investing/dividends-income/2007/07/28/
avoid-the-next-dividend-implosion.aspx


AIG, Chubb, Allstate Buybacks Portend Lower Premiums
Bloomberg
By: Hugh Son and ZacharyR. Mider
July 27, 2007
http://www.bloomberg.com/apps/news?pid=20601109&sid=aMSqV8pgEMH0&refer=home


Pre-Election Year Stock Market Returns: Update

In December of last year, I published a post containing a chart from Chart of the Day detailing pre-election year stock market returns. As noted in the below chart, historically, the strongest part of the returns in a pre-election year occurred in the first 6-7 months. The market gains further momentum in the last three months of the year. This year seems to be following a similar pattern.

(click on chart for larger image)


Saturday, July 28, 2007

Fed Tightening Cycles and Past Financial Crises

It is not much of a surprise that this Fed tightening cycle has resulted in a subprime financial crisis. The question now is whether or not the subprime issues will spread to the broader economy and tip the economy into a recession. The chart below displays past tightening cycles and the resultant financial crisis. The blue shaded area of the chart denotes past economic recessions.

(click on chart for larger image)

Fed tightening cycles and past financial crises
Source:
The Next Rogue Wave
Financial Sense
By: Jim Puplava
December 15, 2006
http://www.financialsense.com/stormwatch/2006/1215.html


Friday, July 27, 2007

What is Subprime Credit Anyway

A large part of the news impacting the stock market at this time is related to the subprime debt market. Many investors are confused as to what the subprime market is. The Financial Times recently published an interview that defined this market. Following is an excerpt from the interview:
...Very simply, investors over the last few years have been looking for places to put money to work. Corporates haven’t been borrowing, and even governments have enjoyed improving budget balances and have had to borrow less. Forced to find a place to put their money to work, investors began to look to subprime borrowers - the individuals with either low income or bad credit or both - as a potential investment option. Banks would provide the cash for mortgage loans to subprime borrowers, and then they would bundle those loans up into one big package, sometimes called a pool, and then sell securities whose value was linked to the performance of the pool of mortgages. Investors could buy the securities and were effectively lending money to the subprime borrowers, with the banks serving as the middlemen.

The collapse has been due to something very simple: people lent money to borrowers who couldn’t pay it back. Now the process is beginning to snowball; subprime borrowers are defaulting, which puts homes on the market for a forced sale, which drags prices down, which makes it more difficult for other subprime borrowers to refinance their mortgages into loans with better terms, which then causes more defaults.
Barry Ritholtz, the Chief Market Strategist for Ritholtz Research, maintains a web blog, The Big Picture. He recently posted a graphic that diagrams the various subprime pieces and how they are created.

Source:
Turmoil in the Credit Markets
Financial Times
July 19, 2007
http://www.ft.com/cms/s/5a314eb4-3612-11dc-ad42-0000779fd2ac.html

Cool! Residential Mortgage Backed Securitization Process
The Big Picture
By: Barry Ritholtz
July 27, 2007
http://bigpicture.typepad.com/comments/2007/07/cool-residentia.html


Bullish Sentiment Continues Higher

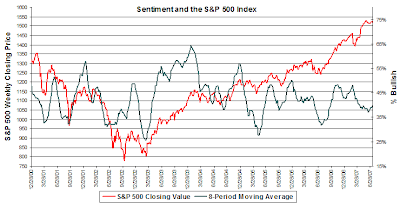
This past week, the American Association of Individual Investors reported that bullish sentiment rose to 44.21% versus last week's reading of 41.77%. The 8-period moving average continues to trend higher as well: 41.7% versus last week's 40.3%. The 44.21% bullish reading was the highest level for this measurement since the April 19, 2007 reading of 46.94%. Not so ironically, bullish investors were rewarded with a 4.2% decline in the Dow index this week.

(click on graph for larger image)


Wednesday, July 25, 2007

Anheuser-Busch and Bank of America Announce Double Digit Percentage Increase in Dividend

Anheuser-Busch (BUD) and Bank of America (BAC) announce double digit increases in their quarterly cash dividends.

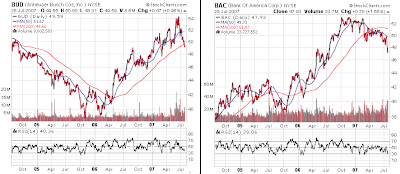
Anheuser-Busch increased its quarterly dividend 11.9% to 33 cents per share versus 29.5 cents per share in the same period last year. The payout ratio, based on 2007 estimated earnings of $2.81, is 47%. Anheuser-Busch has an S&P Quality Ranking of A+.

Bank of America increased its dividend 14.3% to 64 cents per share versus 56 cents per share in the same period last year. The new dividend yield, based on today's closing stock price of $47.93, increases to 5.34%. The payout ratio increase to 52% based on 2007 estimated earnings of $4.92. BAC's S&P Quality Ranking is A.

(click on table/chart for larger image)

Anheuser Busch and Bank of America Dividend Analysis July 25, 2007
Anheuser Busch and Bank of America stock chart. July 25, 2007


Tuesday, July 24, 2007

Performance of Dividend Focused ETFs in Down Market: July 24, 2007

With the weaker performing market over the last several days, I thought it would be interesting to see how the dividend focused exchange traded funds performed relative to the general market. Many of the ETFs noted below contain a large portion of the investment allocation in financials and utilities due to the attractive yield on stocks in those sectors. Although only one day, it appears yield alone was not enough to provide downside support to a stock or ETF in the down market.

As noted in the chart below, the bottom three performing sectors on Tuesday in the S&P 500 Index were financial, energy and utilities:

(click on table for larger image)

sector performance S&P 500 Index. July 24, 2007Source: Standard & Poor's

The performance of several dividend focused ETFs are detailed in the following table:

(click on table for larger image)

Dividend Focused ETF performance. July 24, 2007


Wells Fargo and Gannett Announce Dividend Increases

Today Wells Fargo (WFC) and Gannett (GCI) both announced increases in their quarterly dividends.

Wells Fargo increased its quarterly dividend 10.7% to 31 cents per share versus 28 cents per share in the same quarter last year. This represents the 20th consecutive year WFC has increased its dividend and is the 25th increase since 1987. The estimated payout ratio on estimated 2007 earnings of $2.74 is 45%. WFC carries an A quality ranking from Standard & Poor's.

Wells Fargo dividend analysis. July 24, 2007
Wells Fargo Stock Chart. July24, 2007
Gannett also increased its dividend today by 29%. The quarterly dividend increases to 40 cents per share versus 31 cents per share in the same quarter last year. The payout ratio based on 2007 estimated earnings of $4.53 is approximately 35%. GCI has carries an A S&P quality ranking.

Gannett dividend analysis. July 24, 2007
Gannett stock chart. July 24, 2007


Monday, July 23, 2007

Stanley Works Raises Dividend 3.3%

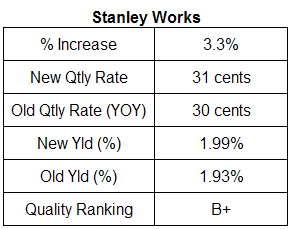
On Friday, Stanley Works (SWK) announced a 3.3% increase in the company's quarterly dividend to 31 cents per share versus 30 cents per share in the same quarter last year. This increase represents the 40th consecutive year the company has increased its dividend on an annual basis. The estimated payout ratio based on estimated 2007 earnings of $3.99 is approximately 31%. SWK is one of Standard & Poor's dividend aristocrats and has a quality ranking of B+.

Stanley Works dividend analysis July 23, 2007
Stanley Works stock chart July 23, 2007


Sunday, July 22, 2007

The Out of Balance Balance Sheet: A Hidden Treasure Trove or Fools Gold

One event impacting the stock market of late has been the high level of stock buyback activity. The heightened buyback activity has not gone unnoticed by many, including Standard & Poor's. In a recent report by S&P titled, S&P 500: Buybacks and Treasury Shares The Overlooked and Hidden Assets, they note:
  • Buybacks in 2006 totaled $432 billion.
  • 56.8% of the 500 companies reduced their share count.
  • Buybacks boosted EPS by at least 4% for more than 20% of the issues in 2006.
  • Over the ten quarters between Q4 2004 and Q1 2007, S&P 500 issues spent $965 billion on buybacks, slightly less than the $1,010 billion spent on capital expenditures, and substantially more than the $534 billion paid in the form of common dividends.
  • In 2006, S&P 500 companies spend more on buybacks ($432 billion) than the United States government spent on Medicare ($408 billion).
Some of the more interesting statistics center around the impact of issues' treasury shares:
  • S&P 500 treasury shares increased 19.7% in 2006.
  • The market value of S&P 500 treasury shares is $590 billion higher than their balance sheet posting, and represents 12.4% of the current market value.
For the most part, these buybacks have resulted in an increase in a company's treasury shares. In other words, the company has not retired the shares that were repurchased.

S&P notes if the 338 issues with treasury shares made a mark-to-market adjustment to the value of the shares, the market value increase would be $589 billion. The total market value of the treasury shares would be $1,591 billion, representing 17.6% of their market value. For the S&P 500 Industrials (Old) [see S&P report at link below].

The implication for these companies is:
The availability of this discretionary liquid asset, cash and treasury shares, makes almost every company a potential growth issue and many a potential take-over target. What companies choose to do with this enormous asset is perhaps the most important decision facing them, and it could have long-lasting effects as to their profitability and market value for years to come...Buybacks, while adding to short-term returns, are temporary in nature if the shares are not retired - which they have not been. Cash build-ups that are now being used to supplement earnings via interest income and reduce share count are not a substitute for operating earning and, as such, should not be priced into future earnings or multiples.

Source:
S&P 500: Buybacks and Treasury Shares The Overlooked and Hidden Assets (pdf)
Standard & Poor's
By: Howard Silverblatt and Dave Guarino
July 19, 2007
http://www2.standardandpoors.com/spf/pdf/index/071907_BuybacksReport.pdf


Saturday, July 21, 2007

Will Oil Stock Prices Hit a Dry Hole in the Third Quarter?

In mid May of this year the average spot price for a barrel of oil was a little over $61 per barrel. At the same time, the average price of a gallon of gasoline was $3.25. Fast forward to mid July and the average spot price of a barrel of oil is $73.44 versus the average price of a gallon of gasoline of $3.09.

(click on chart for larger image)

As the price of a barrel of oil trends higher, the pump price for gasoline has actually declined. What could be at play is oil company desires to keep a lid on profits so Congress does not impose additional taxes on the integrated oil firms. Will a result of this action by oil firms be earnings in the third quarter that do not achieve the expectations of analysts and investors?


Thursday, July 19, 2007

Bullish Sentiment Declines and Equity Market Moves Higher

The contrarian investor sentiment indicator proved correct last week as individual investor bullish sentiment declined, yet the S&P 500 Index moved higher. For the period ending July 18, 2007, bullish sentiment declined to 41.77% versus last week's 43.64% as reported by the Association of Individual Investors. The magnitude of the decline in bullishness was picked up in an increase in investor bearishness to 36.71% versus last week's 30.0%. On an 8-period moving average basis, the bullish sentiment continues to drift higher at 40.3% versus last week's 39.8%.

(click on chart for larger image)


Wednesday, July 18, 2007

M&T Bank Raises Dividend 16.7%

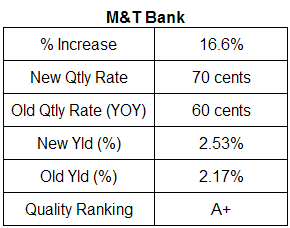
M&T Bank (MTB) announced a 16.7% increase in its quarterly dividend to 70 cents per share from 60 cents per share in the same quarter last year. MTB is an S&P Dividend Aristocrat with an A+ S&P Quality Ranking. The projected payout ratio based on estimated 2007 earning per share of $7.42 is 38%.

(click on table/chart for larger image)

M&T Bank dividend analysis table. July 2007
M&T Bank stock chart July 2007


Monday, July 16, 2007

Substantial Increase in Foreign Sales by U.S.Companies in the S&P 500 Index

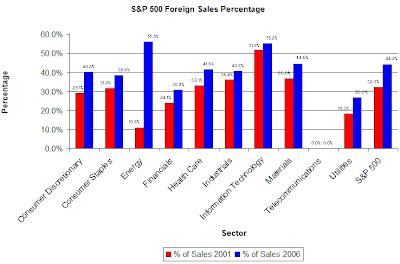
Standard & Poor's recently released a report detailing the growth in foreign sales by companies represented in the S&P 500 Index. The report notes S&P 500 companies generate over 44% of sales from overseas. This compares to approximately 32% in 2001.

(click on chart for larger image)

foreign sales percentage for S&P 500 companies as of 2006
Howard Silverblatt, Senior Index Analyst at Standard & Poor's notes:
"The significant increase in foreign sales by U.S. companies over the past five years is due to the rapidly expanding foreign market for goods and services. We believe that the present trend will continue with greater portions of U.S. products being produced and sold abroad.”
As noted in S&P's press release dated July 9, 2007:
Standard & Poor’s findings were based on fiscal year 2006 data for issues with full reporting information, representing 53.7% of the S&P 500’s market value. Standard & Poor’s also calculated that an additional 0.95% of sales was generated from U.S. produced goods and services that were exported abroad, down from the 1.14% reported in 2005.
The positive impact for U.S. firms has come from the weaker dollar. With a weaker US dollar, companies report higher sales as the foreign currency is converted back into the Dollar. A key point for investors is what event(s) will cause the Dollar to strengthen and reverse this earnings enhancing tailwind?

Source:

Foreign Sales by U.S. Companies on the Rise, Says S&P
Standard & Poor's
By: David R. Guarino and Howard Silverblatt
July 9, 2007
http://www2.standardandpoors.com/portal/site/sp/en/us/page.article/2,3,2,2,1148445747756.html


Thursday, July 12, 2007

Bullish Sentiment Is Essentially Unchanged

This week the American Association of Individual Investors reported individual investor bullish sentiment of 43.64%. This compares to last week's bullish sentiment reading of 43.84%. The 8-period moving average of the bullish sentiment reading increased to 39.8% versus 39.1% last week.

(click on graph for larger image)

investor sentiment chart. July 12, 2007


Paychex Increases Dividend 87.5%

Paychex (PAYX) announced an 87.5% year over year increase in the company's quarterly dividend. The new quarterly dividend payable in the 3rd quarter of this year will be 30 cents per share versus 16 cents per share in the same quarter last year. A first for the company was the announcement of a $1 billion stock buyback.

The company has a May year end and estimated 12-month earnings beginning with the company's 3rd quarter (Feb. 2007) through 2nd quarter next year (Nov. 2008) equals $1.50. The projected payout ratio is approximately 80%. The payout ratio has trended higher from the low 60% range since 2004. PAYX has a Standard and Poor's Quality Ranking of A+ and is one of S&P's Dividend Aristocrats.

(click on chart/table for larger image)

Paychex dividend analysis table. July 12, 2007
Paychex stock chart. July 12, 2007


Wednesday, July 11, 2007

Walgreen Increases Dividend 22.6%

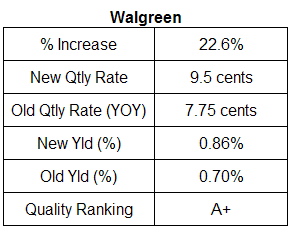
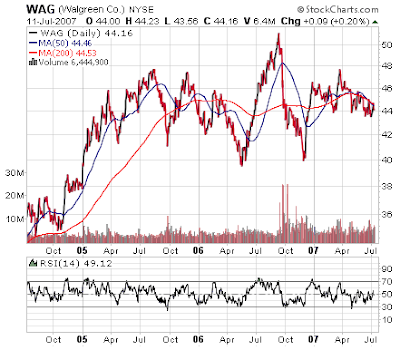
Today, Walgreen (WAG) announced a 22.6% increase in the company's quarterly dividend. The company's 3rd quarter dividend increases to 9.5 cents per share versus 7.75 cents per share in the same quarter last year. The projected payout ratio based on 2007 estimated earnings of 2.12 will equal 18%. WAG carries an A+ S&P Quality Ranking and is one of Standard & Poor's Dividend Aristocrats.

(click on table/chart for larger image)

Walgreen dividend analysis table July 2007
Walgreen stock chart July 2007


Monday, July 09, 2007

Stock Buybacks Distort Earnings Per Share Growth

In this market advance one fact analyst can agree on is the level of stock buybacks has been large. Just today, Johnson & Johnson (JNJ) approved a $10 billion stock buyback. ConocoPhillips (COP) announced a $15 billion stock buyback.

In the case of JNJ, the $10 billion dollar buyback would represent about 5.5% of the company's outstanding shares at today's closing price of $62.72. JNJ has 2.87 billion shares outstanding. If the buyback were completed today, the share count would reduce to approximately 2.71 billion shares. Analysts' earnings per share estimate for year end 2007 is $4.04. This equates to a net income figure of about $11.59 billion dollars. The EPS figure on the lower share count would equal $4.28; thus boosting EPS growth by nearly 6% while actual net earnings remain unchanged.

In an environment where buyback activity is high, an investor must look at the company's growth in revenue, earnings, etc., before converting to a per share basis. This will provide an investor insight into the true growth rate of a company. It is estimated for 2007 that almost one half of the growth in S&P 500 earnings per share will result from share buybacks.

Certainly this buyback activity has contributed to the bull market advance. The reduced number of shares available in the market for investors to purchase is contributing to the upward trend in the market. If the supply is lowered and demand remains the same, prices will move higher.


Saturday, July 07, 2007

Proof Buybacks Have Gained More Attention

One topic that has gained a great deal of attention lately is the increased stock buyback activity. It seems stock buybacks have garnered more attention in the board room than dividend initiations or dividend increases.

In December 2006, the Powershares organization developed an exchange traded fund that replicates Mergent's Buyback Index. The Powershares Buyback Achievers Portfolio trades under the ticker PKW. The PKW Index inception date is 12/20/2006 and has slightly underperformed the S&P 500 Index. On a hypothetical longer term performance basis, the PKW ETF would have outperformed the S&P 500 Index by a fairly wide margin.

(click on chart for larger image)


A chart of the hypothetical returns over a longer time period is detailed below.

(click on chart for larger image)

Powershares buyback index hypothetical performanceSource: Powershares


Thursday, July 05, 2007

Bullish Sentiment Increases for Period Ending July 4, 2007

The American Association of Individual Investors sentiment indicator is know as being a volatileindicator on a weekly basis. The past several weeks measurements are representative of the volatile nature of this indicator.

For the period ending July 4, 2007, bullish sentiment increased to 43.84% versus 39.02% last week. The 8-period moving average increased slightly to 39.1% versus 39% last week. Since 2000 the 8-period moving average was 53.5% in mid December 2000 and 62.9% at the end of January 2004.

(click on graph for larger image)


Wednesday, July 04, 2007

Fewer Dividend Increases Reported

On Tuesday Standard and Poor's reported that 7% fewer companies reported dividend increases in the 2nd quarter of 2007 versus 2006. The universe consisted of 7,000 publicly traded companies that report dividend increases to S&P.

Howard Silverblatt, an analyst at S&P noted:
"The decline in dividend increases is disturbing, especially in light of continued, moderate earnings growth and the abundance of corporate cash. We believe the present wave of corporate buybacks is contributing to the slower pace of dividend growth in 2007."
On the other hand, more companies announced "extra" dividends in the 2nd quarter, 92 versus 89. Also, the total number of dividend payers increased by 3% versus 2006.

It appears companies are more comfortable with stock buybacks and extra dividends than committing to ongoing higher dividends a a regular basis. Are companies signaling something about their business prospects going forward if they are not willing to commit to higher ongoing dividend payments.


Monday, July 02, 2007

Dividend Payers versus Non-Payers Performance as of June 30, 2007

For the month of June, the dividend paying stocks in the S&P 500 Index underperformed the non-payers by a fairly wide margin, .96% versus 2.12%, respectively. On a year to date and 12-month basis, the payers are underperforming the non-payers as well. On an average return basis though, both payers and non-payers are outperforming the S&P 500 index year to date and for 12-months.

Dividend Payers vs. Non-Payers Performance


Sunday, July 01, 2007

Financial Planning Toolkit from CCH

CCH has created a website that provides a large number of free financial planning tools. These tools are separated into various categories, but in general, they are broken out as follows:
  • The information you need to manage your personal finances.
  • Calculators to help you assess your financial position and better manage your money.
  • Forms and tools to help you organize and manage your personal finances.
The site enables one to evaluate a number of essential factors important to achieving financial goals. A portion of the Table of Contents is detailed below:


Who Is Watching Your 401(k) Investments?

This week's Businessweek issue contains a number of articles and suggestions on how to retire early. One of the articles discussed the importance of seeking outside advice in the management of ones 401(k) investments. Simply obtaing advice is only one piece of the puzzle. The article notes the advice needs to be the right advice.

If one plans on seeking an independent adviser to assist in management of their 401(k), one should obtain answers to the following questions noted in the article:
  • How well does the adviser know your plan? Ideally the person should be familiar with or willing to learn about how your 401(k) works and the investment choices available.
  • How will your adviser find the right investment mix for you? Smart asset allocation and consistent rebalancing are the main investing strategies that can make early retirement a reality.
  • How closely will the adviser monitor your plan? Through the internet, 401(k) investors can keep an eye on their account daily if they so choose. Your adviser should be watching regularly, too, and sending you alerts if you need to rebalance or make other changes.
More detailed information on this topic can be found by clicking the article's link noted below.

Source:
Who'll Coodle Your Nest Egg
BusinessWeek Magazine
July 9, 2007
http://www.businessweek.com/magazine/content/07_28/b4042402.htm