Sunday, December 31, 2006

Readings for the New Year

Following are several links to articles discussing the relationship of dividend growth to earnings growth.
    • As noted below, the article concludes future earnings growth is highest for the firms that have high current payout ratios. The article does offer the caution that an investor needs to determine if a company with a high payout ratio can maintain the dividend at the current high rate.
    • "We investigate whether dividend policy, as observed in the payout ratio of the U.S. equity market portfolio, forecasts future aggregate earnings growth. The historical evidence strongly suggests that expected future earnings growth is fastest when current payout ratios are high and slowest when payout ratios are low. This relationship is not subsumed by other factors, such as simple mean reversion in earnings. Our evidence thus contradicts the views of many who believe that substantial reinvestment of retained earnings will fuel faster future earnings growth. Rather, it is consistent with anecdotal tales about managers signaling their earnings expectations through dividends or engaging, at times, in inefficient empire building. Our findings offer a challenge to market observers who see the low dividend payouts of recent times as a sign of strong future earnings to come."
    • The article provides an analysis similar to the yield to maturity (YTM) calculation for bonds. The Hussman article contains a formula an investor can use to determine YTM for stock investments.
    • "...For stocks, the "yield-to-maturity" comes from two components: income plus capital gain. The income component is simply the dividend yield. Assume initially that the dividend yield is held constant over time...If the dividend yield (Dividend/Price) is constant, then by definition, prices must grow at exactly the same rate as dividends grow. By definition, when the dividend yield is unchanged between the date you buy stocks and the date you sell them, your total return equals the dividend yield (income) plus the growth rate of dividends (capital gain)."


Saturday, December 30, 2006

Dividend Aristocrat Performance as of 12.29.2006

Following is a summary of the S&P Dividend Aristocrat's performance as of 12.29.2006. For the 4-week period, the Aristocrats outperformed the US domestic indices except for the Dow Jones Industrial Average.

(click on chart for larger image)


Friday, December 29, 2006

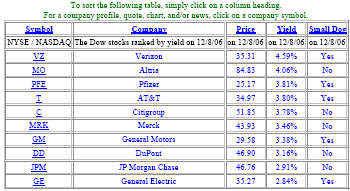
Potential Dow Dogs for 2007

Following is a table for the potential Dogs of the Dow for 2007.

(click on table for larger image)

Source: Dogs of the Dow

The performance for the 2006 Dogs of the Dow can be found at this link. Note, the performance does not include dividends


Thursday, December 28, 2006

Bullish Sentiment Jumps

The American Association of Individual Investors sentiment indicator saw a larger jump in bullishness for the 12.28.2006 reporting period. This is a contrarian indicator; thus indicating the market might be getting a little extended. Certainly not hard to believe since the Dow is hitting new highs.

(click on table for larger image)


Wednesday, December 27, 2006

Pre-Election Year Stock Market Performance

Below is a chart from Chart of the Day detailing historical performance of the Dow in a pre-election year. As the chart shows, the market tends to be the strongest in the first half of the pre-election year.

(click on chart for larger image)


Tuesday, December 26, 2006

Dogs of the Aristocrats

An often cited investment strategy is the Dogs of the Dow. This strategy involves investing an equal dollar amount, on the first business day of a given year, in the top ten yielding Dow stocks as of the last business day of the prior year.

I thought it might be interesting to look at the top yielding stocks from S&P's Dividend Aristocrats. I have done no back testing of returns for this strategy, but below, I have listed the top yielding Aristocrats as of 1/26/2006. The stocks highlighted in yellow are in the running for inclusion in the Dow Dogs for 2007:

(click on table for larger image)


Monday, December 25, 2006

Financial Savings Targets

A key aspect in developing ones investment plan is establishing a financial plan to ensure goals and objectives are being achieved on an ongoing basis. An important component of the plan is the development of specific asset value targets to be achieved on an annual basis.

An article recently published in the Journal of Financial Planning, Personal Financial Ratios: An Elegant Road Map to Financial Health and Retirement describes a process to determine what level of investment assets may be required in order to retire in comfort.

The article contains the following executive summary:
  • "Investors commonly use stock ratios such as the price to earnings, price to book, and dividend yield to assess the financial health of a company because the ratios concisely benchmark a company's financial status.
  • Clients and their financial advisors have no comparable ratios that would allow investors to conduct a similar analysis of their personal financial circumstances. This article establishes a set of personal financial ratios that individuals can use to analyze their financial standing. Just as stock ratios are primarily based on a company's earnings, the personal financial ratios are based on an individual's income. There are three ratios: savings to income, debt to income, and savings rate to income.
  • The ratios are derived from a series of assumptions including household budgets, post-retirement income replacement, rates of return, and retirement distribution rates.
  • The ratios are designed to serve as a road map so that investors can compare their individual ratios against the benchmarks to determine whether they are on track to retire by age 65. The ratios serve as a practical tool for advisors to help convey to their clients the fundamental relationship between one's income, debt, and savings rate, and how those relationships must change over time."
The article concludes by stating, "...ratios also provide households with a practical tool for analyzing their personal finances and the progress they are making toward financial independence." The article provides a process an investor can go through in determining appropriate levels of retirement savings needed at various stages in their lifecycle.


Source:
Personal Financial Ratios: An Elegant Road Map to Financial Health and Retirement
By: Charles J. Farrell, J.D., LL.M.
January, 2006
http://www.fpanet.org/journal/articles/2006_Issues/jfp0106-art6.cfm


Sunday, December 24, 2006

Investing New Year Resolutions for 2007

As the new year approaches, many individuals will provide their best guesstimate on what will unfold for the markets and the economy in 2007. The one resolution I believe many investors should adopt is that of committing to gain a better understanding of their investments and why they choose to invest in particular companies. Over the course of the next week, I intend to highlight material on different investment and wealth management topics, such as financial planning, etc.

A quote in the recent newsletter from Investment Quality Trends:

"To some market valuations are hostile. To others, market valuations offer opportunity. We will leave the discussion about the market valuations to others because we don't know how to value markets; we do know how to value stocks."

To facilitate staying on track with this type of resolution, following are links to posts and/or articles that might enhance ones investment understanding as we enter the year 2007.
  • Taking the Spin Out of Earnings Announcements. This article from the CFA Institute and featured on the American Association of Individual Investors website covers nine key points to consider when analyzing corporate earnings announcements.
  • For the new investor, Starting an Investment Program with Dollar Cost Averaging.
    "The first step is always the hardest. And individual investors taking their first steps in an investment program must also confront a sea of stock market uncertainty. Some plunge headlong into the market with all their savings. Others barely wet their feet before heading back to the safe shores of their money market funds. The problem, however, with these two all-or-nothing approaches is one of timing—the risk of entering the market at a high point in the market cycle...."
  • Read a book featuring details on some of the more successful market investors.
    • The Intelligent Investor by Benjamin Graham. Ben Graham is often called the "Father of Value Investing" and the "Dean of Wall Street". Warren Buffett often cites Ben Graham material. Warren Buffett studied under Ben Graham at Columbia University and Warren Buffett was the only student to ever get an A+ in a Benjamin Graham class.
    • The Future for Investors by Jeremy Siegel. The Future for Investors reveals new strategies that take advantage of the dramatic changes and opportunities that will appear in world markets. He finds new technologies, expanding industries, and fast growing countries that stockholders relentlessly seek in the market often leads to poor returns. In fact growth itself can be an investment trap, luring investors into overpriced stocks and overly competitive industries. The book challenges conventional wisdom and provides a framework for picking stocks that will be long run winners.
    • The Essays of Warren Buffett by Warren E. Buffett, Lawrence A. Cunningham. The Wall Street Journal, July 6, 2000, Front Page, "Cunningham's Buffett Essays ranked #3 on JP Morgan's 10-book list of "Summer Must-Reads for Millionaires"


Standard and Poor's New Dividend Aristocrats for 2007: Update

Following is S&P's rational for the changes to the Dividend Aristocrats portfolio.

(click on table for larger image)


Source: Standard and Poor's


Friday, December 22, 2006

Dividend Aristocrats Outperform for the Week

On a market weighted basis, S&P's Dividend Aristocrats outperform for the week ending 12.22.2006.


(click on table for larger image)


State Street Raises Dividend...But

Yesterday, State Street (STT) announced a YOY increased in its quarterly dividend of 10.5%. Details of the increase are noted below.

The 10.5% increase is lower than the company's historical increases. The company's rate of dividend growth has steadily declined from 19% in 2001 to the current 10%. Keep in mind though, STT is a company that increases its dividend every third quarter. This slowing of the dividend growth rate indicates an investor should research to see if the company's board is signaling a slow down in STT's earnings growth.

Year over Year Percentage Change


Thursday, December 21, 2006

Bullish Sentiment Declines in the Period Ending 12.20.2006

In the American Association of Individual Investors sentiment survey release this week, bullish sentiment declined and bearishness increased a full 4.5 percentage points. The bullish trend in this contrarian indicator has been down since bullishness hit a high of 54.2% in the October 19th measurement period. If bullish sentiment falls to a level like July 20th, this would be one indication the equity markets may rally.

(click on chart for larger image)


Source: American Association of Individual Investors


Wednesday, December 20, 2006

S&P 500 Index Changes and Impact on Price of Stocks

Standard and Poor's made the following change to the S&P 500 Index on 12/19/2006. The stock chart shows the impact on the stock trading volume and resultant impact on the company's stock price upon being added to the S&P 500 Index.

(click on charts for larger image)


Following are the index changes that go into effect on 12/29/2006.


Spectra is the midstream gas business of Duke (DUK). The Spectra spin off is slated to close by 1.2.2007.


Dividend Aristocrats Performance 12.19.2006

NASDAQ Index lands in bottom third of performance ranking of Dividend Aristocrats Also include 1-month industry returns.

(click on chart for larger image)

Source: MSN Money


Tuesday, December 19, 2006

Thai Government Relaxes Investment Restrictions

This afternoon the Thai government retracted (earlier post) their announcement that they would restrict the flow of foreign funds in equity investments. The Thai government restrictions would remain on bonds and commercial paper though.

In the afternoon email alert from the Online Edition of the Wall Street Journal, Tim Annett stated,
"Ironically, a successful military coup this September against Prime Minister Thaksin Shinawatra lured some investors back to the nation's stock market in the belief that the Thai economy and political system might stabilize following a stretch of cronyism and mismanagement. This week's decision, the first big economic-policy move by the military-led government, seems certain to shake investor confidence in the new leaders. And the fact that the decision was so readily overturned after the market meltdown probably won't do much to strengthen the government's economic credibility, either, since it may reveal a lack of conviction at best or a lack of expertise at worst."
This is the type of activity that can contribute to market disruptions longer term. Time will tell.

Source:
Thai Take-Out
Tim Annett
The Wall Street Journal Online ($)
December 19, 2006, 12:41pm
http://online.wsj.com/article/SB116653266791254472-search.html?KEYWORDS=annett&COLLECTION=wsjie/6month


Pfizer Increases Dividend 21%

Pfizer (PFE) announced a 21% YOY increase in its first quarter 2007 dividend. This places the projected yield on the new dividend at 4.5%. Pfizer's highest yield historically had been about 4%.


Emerging Market Thailand Imposes Restrictions on Foreign Investors

The emerging markets declined overnight on Thailand's currency control announcement. These controls will negatively impact foreign investors. These are the type of unforeseen market events that can create stock market corrections. Higher quality dividend paying stocks should be a safe haven today relative to other markets.

Thai Stocks Tank on New Investment Rules

BANGKOK, Thailand (AP) - Thai stocks plummeted 15 percent Tuesday after the country's central bank introduced new controls on foreign investment, rattling markets throughout the region in the most dramatic turmoil since the 1997 Asian financial crisis.

Investors dumped stocks in Hong Kong, India, Indonesia and Malaysia amid concerns that the plunge might to spread through the region and trigger the kind of slump that wracked Asia nearly 10 years ago.

The Stock Exchange of Thailand's benchmark SET Index plunged as much 19.5 percent before recovering some to close at 622.14, down 14.8 percent.

It was the market's biggest drop ever, the stock exchange said. The hardest hit sectors were banking, energy and telecommunications.

The plunge came after the Bank of Thailand late Monday announced its toughest measures yet to clamp down on speculative inflows that have lifted the Thai currency, the baht, to a nine-year high of 35.09 to the U.S. dollar Monday. On Tuesday, the baht weakened to 35.93 per dollar.

Starting Tuesday, all banks are required to hold in reserve for one year 30 percent of capital inflows that aren't trade- or services-related, or repatriation of Thai residents' investments abroad, the bank said. Also, foreign investors must pay a 10 percent penalty unless they keep funds in the country for a year.

Effectively, the central bank's new rules mean that if a foreign investor allocated the equivalent of 100 million baht to the Thai bond market, the investor could only buy 70 million baht of bonds, while the remainder would be withheld by the central bank, earning no interest. If the investor wanted to withdraw the money in less than a year, only two-thirds of the amount withheld would be returned.

"Foreign investors are nervous about the measure introduced by the central bank," said Sukhbir Kanijoh, an analyst with Kasikorn Securities in Bangkok.

"Many are also worried that more measures will be introduced to curb the strengthening baht that will make the Thai market even less attractive," he said. "Selling is heavy and selling orders will likely continue throughout tomorrow, unless there is a revision to the measure."

But David Cohen, chief of Asian economic forecasting for Action Economics in Singapore, said the events in Thailand are fundamentally different from the events surrounding the 1997-98 Asian financial crisis.

The big problem 10 years ago was currency weakness; now, it's currency strength.

"I would emphasize the contrast to the situation in '97 and '98. The measures the Bank of Thailand felt obliged to impose were to resist the appreciation of their currency," Cohen said.

Ben Kwong, chief operating officer at KGI Asia in Hong Kong, also said regional economies are now "relatively healthy" compared with the situation in 1997.

"The situation is different now. Many regional economies have achieved more balanced accounts and currencies are likely to go up, not down," he said.

Thailand's measures "aim to change the rules of the game and were a blow to foreign investors' confidence. The big market reaction is understandable," he said. "But there shouldn't be any long-term effects on Hong Kong."

The Stock Exchange of Thailand on Tuesday called for the central bank to review its decision to impose new rules aimed at weakening the baht, saying the move prompted foreign investors to dump Thai shares.


Monday, December 18, 2006

Eli Lilly Dividend Analysis

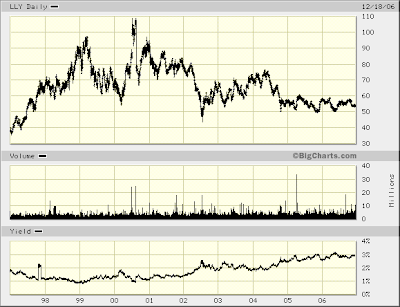
Lilly (LLY) announced a 6.2% YOY increase in its quarterly dividend today. The 5-year average payout ratio averages 51%. The payout ratio has trended higher during this period, with a low payout of 41%in 2002.


As noted in past posts, the dividend growth rate is a factor that receives a lot of weight in analyzing the potential growth prospects of a company. A dividend growth stock's long run return tends to match its dividend growth rate, all else being equal. Is Lilly's 6.2% increase an indication of slower growth for LLY? Following are two tables detailing some company financial information:

(click on charts for larger image)


LLY has continued to use cash through September 2006 with cash and short term investments totaling approximately $3.6B. So the question becomes is sufficient information available that warrants selling or purchasing the stock?

Additional key factors:
  • high dividend yield over last 15-years equals 5% in mid 1994.
  • low dividend yield over past 15-years equals .9% at the end of 1998.
  • stocks appears to be making a bottom in the low $50's.

  • Lilly has a fairly strong drug pipeline: Prasugrel (anti-platelet agent), an inhaled insulin drug, long acting version of Byetta (diabetes), and a cancer drug.
  • FDA requiring additional Phase III study for the diabetic drug Arxxant


T. Rowe Price Raises Dividend 21%

Last week T. Rowe Price (TROW) raised its quarterly dividend 21%. This dividend action is the 20th consecutive year the company has raised its quarterly dividend.

One technical factor to review when purchasing dividend growth stocks is the company's current yield relative to the historical yield for the stock. The 15-year range of the yield for TROW is a high yield of 2.6% and a low yield of .8%. The new yield on the new quarterly dividend is 1.5%.


(click on chart for larger image)


Saturday, December 16, 2006

Modern Portfolio Theory and Concentrated Investments

An often cited aspect to investing is the construction of an investment portfolio under the discipline of Modern Portfolio Theory or MPT. Yahoo Finance provides a layman's description of MPT:
"You can divide the history of investing in the United States into two periods: before and after 1952. That was the year that an economics student at the University of Chicago named Harry Markowitz published his doctoral thesis. His work was the beginning of what is now known as Modern Portfolio Theory. How important was Markowitz's paper? He received a Nobel Prize in economics in 1990 because of his research and its long-lasting effect on how investors approach investing today.

Markowitz starts out with the assumption that all investors would like to avoid risk whenever possible. He defines risk as a standard deviation of expected returns.

Rather than look at risk on an individual security level, Markowitz proposes that you measure the risk of an entire portfolio. When considering a security for your portfolio, don't base your decision on the amount of risk that carries with it. Instead, consider how that security contributes to the overall risk of your portfolio.

Markowitz then considers how all the investments in a portfolio can be expected to move together in price under the same circumstances. This is called "correlation," and it measures how much you can expect different securities or asset classes to change in price relative to each other.

For instance, high fuel prices might be good for oil companies, but bad for airlines who need to buy the fuel. As a result, you might expect that the stocks of companies in these two industries would often move in opposite directions. These two industries have a negative (or low) correlation. You'll get better diversification in your portfolio if you own one airline and one oil company, rather than two oil companies.

When you put all this together, it's entirely possible to build a portfolio that has much higher average return than the level of risk it contains. So when you build a diversified portfolio and spread out your investments by asset class, you're really just managing risk and return."

With an investment approach that attempts to construct an investment portfolio with the goal of generating the best "risk adjusted" return, investors need to realize, this may not be the portfolio that generates the highest absolute return.

In a paper by Ed Easterling at Crestmont Research, he notes,
"Over the past several decades, the financial community has also realized that the theories of market efficiency, an important assumption for MPT and CAPM, may not be as strict as originally hypothesized. Financial markets are an efficiency process, rather than an efficient condition. In other words, markets function to find the right prices over time, but don’t always reflect all of the information all of the time..."
Additionally, Mr. Easterling's article makes the observation,
"...diversification in a portfolio applies to risks, not securities. Other than not being familiar with the investment alternatives, what other rational reason would explain why investors concentrate their portfolios into two major risks when so many options are available?"
At the time of Harry Markowitz's MPT study, an investor essentially had the choice of investing in stocks, bonds or cash. Today, an investor has many more investment choices, be it good or bad.

So, since MPT diversification applies to risk and not securities, it is possible that concentrated investment portfolios, in and of themselves, may not be a poor investment decision. On the other hand, today, the volatility of the markets is greater than what has been experienced in the past. This greater volatility is compounded in down markets as noted in the chart below.

(click on graph for larger image)

Copyright 2006, Crestmont Research, (www.CrestmontResearch.com)

Because volatility is greater in down markets, one way to potentially minimize the downside of an equity portfolio is to invest in securities that tend to hold their value better in down markets. As noted in prior posts, studies by Standard & Poor's indicate higher quality dividend paying stocks have historically held up better in down markets. This is important because negative returns have the most detrimental impact on long run returns as noted below:

(click on chart for larger image)

As detailed in the lower right-hand portion of the above chart, each of the six portfolios have the same average rate of return; however, the portfolio that had no negative return periods has the highest compound rate of return.

In conclusion, it is important to remember minimizing risk is really the focus of constructing an investment portfolio. Concentrated investments in individual securities can result in poor returns if their investment characteristics indicate they are more volatile. For example, Black & Decker lost nearly 10% or $8+ in value yesterday. Conversely, utilizing a dividend growth investment discipline to select ones investments may lead to lower downside equity returns; hence, long run outperformance of your investment portfolio.


Friday, December 15, 2006

Inflation and P/E Ratio

Today it was reported November total and core CPI were unchanged from the prior month. The implications of a low inflation environment sent stock prices higher at the market open. The economy (i.e., GDP) continues to grow, albeit at a slower pace, in the third quarter: 2.2% in the third quarter versus 2.6% in the second quarter. Assuming the economy does not slip into a recession, what impact will lower inflation and slower growth have on stock valuations?

Crestmont Research, a research group that promotes hedge fund investing, notes:

"Conventional stock market wisdom has promoted a fundamental relationship between P/E ratios and interest rates. It relied upon a key assumption that inflation was positive—that deflation was not a possibility. As reflected in this chart, P/E ratios increase when inflation trends toward price stability (near 1% inflation) and P/E ratios decline when inflation trends away from price stability. The result is a "Y Curve" effect; where P/E decline into deflation despite low interest rates. This is consistent with the modern 'dividend discount model' since earnings and dividends would be expected to decline during deflation and therefore would result in lower valuations."

(click on chart for larger image)


Conflicting company and economic data continue to influence the market. Today, Black & Decker (BDK) and YRC Worldwide (YRCW), a trucking company, revised earnings guidance lower. Is this a further sign the economy is slowing; thus a weaker period for the market? Or could we be entering a period where we experience some P/E expansion partially as a result of a lower inflation environment. Determining the direction of P/E movement is important as it is one of the three components that determine equity returns:

(click on graph for larger image)

A quote in the recent newsletter from Investment Quality Trends may summarize the situation the best:
"To some market valuations are hostile. To others, market valuations offer opportunity. We will leave the discussion about the market valuations to others because we don't know how to value markets; we do know how to value stocks."


Thursday, December 14, 2006

Bullish Sentiment Ticks Higher

In the American Association of Individual Investors sentiment survey release this week, bullish sentiment increased slightly. The increased bullish came at the expense of a reduction in investor bearishness.

(click on chart for larger image)


Dividend Aristocrats Performance 12.14.2006 and Market Update

Energy and technology have been strong performers over the past two days. Dow component Honeywell helped push blue chips higher after the diversified manufacturer raised its guidance for 2007. This news offset concerns about margins in the fourth-quarter of 2006, sending the stock higher by two percent. However, Exxon Mobile and DuPont provided the largest boost for the Dow, rising 1.77 percent and 2.67 percent respectively. The combination of these three stocks accounted for more than 27 Dow points.

Friday’s session will be highlighted by the consumer price index. If the CPI comes in higher than the 0.2 percent expected, it could hurt stock prices. However, if it falls below estimates, traders will be more likely to buy on hopes the Fed has room to cut rates. The wild card is Friday is an option expiration day. How much of today's activity was related to the expiring options?

(click on table for larger image)


Wednesday, December 13, 2006

Aristocrats Performance 12.13.2006

In a fairly trendless market, the Aristocrats outperformed the domestic benchmarks noted in the tables below. US Bank (USB) certainly contributed to this outperformance on the heals of its 21% dividend increase announced yesterday.
(click on table for larger images)


Tuesday, December 12, 2006

Dividend Aristocrats Performance 12.12.2006

As detailed in the performance chart, most of the banks/financials had a pretty good day.

(click on chart for larger image)

(click on chart for larger image)


Notable Dividend Increases 12.12.2006

Today General Electric (GE) and US Bancorp (USB) announced dividend actions. The table below details components of the increase.

  • GE increased their quarterly dividend by 12% to 28 cents per share versus 25 cents per share in the same quarter last year. One analyst commented, "This has been a stock that has been lagging the market for a while and this clarity on their outlook and visibility of their earnings is being greeted favorably by the market," said Tim Ghriskey, chief investment officer at Solaris Asset Management. "The increase in the dividend is a statement by management and the board that they are comfortable with the performance of the company both today and going into next year."(emphasis added)
  • USB increased their quarterly dividend by 21% to 40 cents per share versus 33 cents per share in the same quarter last year.


S&P Increases Indicated Dividend Rate on S&P 500 Index

S&P increases the estimated 2007 dividend rate for the S&P 500 index. The new estimate is $27.35 versus the $24.63 dividend estimate for 2006. This represents a 11% YOY increase. This dividend rate would result in a payout ratio of approximately 30% based on 2007 earnings. The payout ratio in 1990 for the index was over 50%.

Source: http://news.moneycentral.msn.com/ticker/article.aspx?Feed=PR&Date=20061212&ID=6268251&Symbol=MHP


Dogs of the Dow Performance

A popular strategy that has been around for some time is the "Dogs of the Dow". This is not a dividend growth strategy; however, it is a method that selects Dow stocks strictly on dividend yield. What is this strategy?
Investing in the Dogs of the Dow is relatively simple. After the stock market closes on the last day of the year, of the 30 stocks that make up the Dow Jones Industrial Average, select the ten stocks which have the highest dividend yield...invest an equal dollar amount in each of these ten high yield stocks. Then hold these ten "Dogs of the Dow" for one year.
The YTD 2006 performance of the Dow Dogs is 21.7%:

(click chart for larger image)


If today were the end of the year, the following table details the Dow Dogs that would be purchased for 2007:

(click chart for larger image)


Source: Dogs of the Dow


Monday, December 11, 2006

Dividend Aristocrats Performance 12.11.2006

Following is the performance of the Dividend Aristocrats as of the close of business on 12.11.2006. On a portfolio basis, the aristocrats underperformed the highlighted domestic indices.

(click on chart for larger image)

.


Standard & Poor's Ranking System

When I mention a specific stock in one of my posts, I often cite the company's S&P Earnings and Dividend Quality Ranking. The reason I cite the ranking is the analysis that encompasses a specific grade. Following are a few key factors that go into determining a company's grade. As Standard & Poor's states:

  • Standard & Poor’s has provided Earnings and Dividend Rankings, also known as Quality Rankings, on common stocks since 1956. These Quality Rankings capture Graham and Dodd’s definition of sustainable earnings power, are used in portfolio management as prudent investments, and are commonly employed in investment litigation to determine the prudence of stock investments. A long history of Quality Rankings is available, and several academic and practitioner studies have examined their informativeness and reliability.
  • After analyzing the risk, return, and fundamental characteristics of Quality Rankings portfolios, S&P examines the relationship between Quality Rankings and several other measures of earnings quality. They show that earnings growth of higher-quality firms, as defined by Quality Rankings, is more predictable than that of lower-quality firms. They also show that companies with higher Quality Rankings appear less likely to engage in accounting manipulations. Companies with high Quality Rankings also have higher quality of earnings as defined by the Standard & Poor’s Core Earnings methodology. S&P's analysis shows that high quality stocks indeed have generally traded at higher multiples. The analysis of fundamentals, however, shows that the premium in multiples for the higher-quality portfolio is justified by better fundamentals. Thus, S&P's results show that higher-quality stocks command higher multiples and deliver higher returns. These results are different from the conventional wisdom established by previous studies on risk factors in the U.S. equity markets, and provide a new insight into the risk and return characteristics of U.S. stocks.
  • Finally, S&P report characteristics of current and historical Quality Rankings portfolios. Results show that high-quality stocks generally have greater liquidity, higher average price per share, and larger market value. In addition, Quality Rankings exhibit high stability over time. This implies that portfolio strategies based on Quality Rankings can be executed in practice.
  • The Quality Rankings System attempts to capture the growth and stability of earnings and dividends record in a single symbol. In assessing Quality Rankings, Standard & Poor’s recognizes that earnings and dividend performance is the end result of the interplay of various factors such as products and industry position, corporate resources and financial policy. Over the long run, the record of earnings and dividend performance has a considerable bearing on the relative quality of stocks. The rankings, however, do not profess to reflect all of the factors, tangible or intangible, that bear on stock quality.
  • The rankings are generated by a computerized system and are based on per-share earnings and dividend records of the most recent 10 years – a period long enough to measure significant secular growth, capture indications of basic change in trend as they develop, encompass the full peak-to-peak range of the business cycle, and include a bull and a bear market. Basic scores are computed for earnings and dividends, and then adjusted as indicated by a set of predetermined modifiers for change in the rate of growth, stability within long-term trend, and cyclicality. Adjusted scores for earnings and dividends are then combined to yield a final ranking.
  • The ranking system grants some exceptions to the pure quantitative ranking. Thus, if a company has not paid any dividend over the past 10 years, it is very unlikely that it will rank higher than A-. In addition, companies may receive a bonus score based on their sales volume. If a company omits a dividend on preferred stock, it will receive a rank of no better than C that year. If a company pays a dividend on the common stock, it is highly unlikely that the rank will be below B-, even if it has incurred losses. In addition, if a company files for bankruptcy, the model’s rank is automatically changed to D.

Source:

Standard & Poor's Quality Rankings
Massimo Santicchia and Philip G. Murphy, CFA
October, 2005
http://www.scribd.com/doc/57486255/Quality-Ranking-Whitepaper-Final


Graco Increases Dividend 13.8%

Graco (GGG), supplies technology and expertise for the management of fluids in industrial and commercial applications. Today the company announced it would increase its 1st quarter 2007 dividend by 13.8% YOY to 16.5 cents per quarter versus 14.5 cents per quarter in the same period last year. The 5-year average payout ratio is approximately 27.2% up from 19% in 2001. The stock has an S&P Earnings & Dividend Ranking of A and a yield of 1.6%.


Sunday, December 10, 2006

Biomet: An Acquisition Target?

News sources are reporting Biomet (BMET) , a dividend growth stock, may be acquired by Smith & Nephew Plc. in a transaction valued at $11 billion. Smith & Nephew trades as an ADR under the symbol SNN.

(click on graph for larger image)


Biomet has a 5-year historical dividend growth rate of 30%. The company's last increase in September was 20% higher than the same period last year. The company pays one dividend per year in the 3rd quarter. The stock yields .8% and maintains an S&P Earnings and Dividend Ranking of A.


Saturday, December 09, 2006

Weekend Reading: 12.9.2006

  • Can media cliches such as "goldilocks" economy or "soft landing" be contrarian indicators? This was cited by Barron's (behind firewall) and Barry Richoltz at The Big Picture website. This link is what got this line of thinking started. Note in link #2 the suggestion investors might want to consider high quality, low risk and low U.S. cyclicality type stocks.
  • Steve Halpern at www.thestockadvisors.com has an article on Duke Energy and the company's upcoming spin off of its gas operations. Investors should consult their tax advisers regarding holding, in their IRA, the MLP that will be created after the spin off. MLPs can generate unrelated business taxable income.


Canadian Stocks Rise On Speculation Banks Will Raise Dividends

Toronto Index higher on the week:

(click on chart for larger image)


Canadian Stocks Rally for a Sixth Day; Banks, Biovail Advance

By John Kipphoff

Dec. 6 (Bloomberg) -- Canadian stocks rose on speculation banks will raise dividends, sending the Standard & Poor's/TSC Composite Index toward its longest winning streak in nine months.

Financial shares such as Canadian Imperial Bank of Commerce gained on speculation they will increase payouts amid higher profits and stable or lower borrowing costs. Biovail Corp. advanced after announcing a special dividend.

The Bank of Canada yesterday kept its benchmark interest rate at 4.25 percent after raising its seven times through July, saying growth in Canada and the U.S. in the current quarter may be ``a little weaker'' than previously forecast.

``I absolutely like dividends,'' said Marc Lalonde, who oversees $1.3 billion at Louisbourg Investments Inc. in Moncton, New Brunswick. ``The banks should do well in a low-yield environment.''

The S&P/TSX Composite Index added 47.73, or 0.4 percent, to 12,943.63 as of 3:06 p.m. in Toronto, extending a record. Six days of gains would be the longest run since a similar period ended in mid-March.

A gauge of financial shares, the biggest by value among 10 industry groups in the S&P/TSX, increased 0.4 percent.

Canadian Imperial added C$1.12 to C$92.98. The nation's fifth-biggest lender by assets is scheduled to report fourth- quarter earnings tomorrow. National Bank Financial analyst Robert Wessel forecast the bank will earn C$1.70 per share before extraordinary items, a 17 percent increase from a year ago.

Analysts expect CIBC and larger rival Bank of Nova Scotia to raise dividends this week. Scotiabank, down 10 cents to C$51.45 today, is due to post its results on Dec. 8.

Toronto-Dominion Bank

Toronto-Dominion, Canada's second-largest bank, increased 45 cents to C$68.05. Larger rival Royal Bank of Canada gained 29 cents at C$54.38. Royal Bank, which unveils its results tomorrow, and Toronto-Dominion, whose earnings are due next week, both raised their payouts last quarter.

Lower or stable borrowing costs boost the value of bonds owned by financial companies and increase demand for loans. Dividend payouts may also become more attractive to investors.

The central bank is expected to keep its benchmark rate unchanged at its next meeting Jan. 16, according to the median forecast of 20 economists surveyed by Bloomberg News.

Biovail jumped C$2.34, or 11 percent, to C$23.90 for the top gain in the S&P/TSX, driving a 3.3 percent gain in a measure of health-care shares.

Canada's biggest publicly traded drugmaker announced a restructuring that will see it repay debt and send more money to shareholders instead of spending more on its sales force and acquiring products.

Biovail

Biovail declared a special dividend of 50 cents and said it will redeem all 7 7/8 percent senior subordinated notes. It will also triple its regular quarterly dividend to 37.5 cents a share, from 12.5 cents.

The Mississauga, Ontario-based said it will eliminate its U.S. sales force. It promoted Kenneth Howling to chief financial officer, succeeding Charles Rowland, who will take the same job at Endo Pharmaceuticals Holdings Inc.

The moves came as Biovail forecast lower earnings next year, caused by generic competition to its top-selling drug, the anti- depressant Wellbutrin XL.

A gauge of raw-material shares fell 0.9 percent, limiting the advance in the S&P/TSX.

Gold futures for February delivery slid 1.8 percent to $635.90 an ounce in New York.

Goldcorp Inc., Canada's second-largest bullion miner, lost 50 cents to C$34.45. Kinross Gold Corp. eased 21 cents to C$14.31.

The following shares were having unusual price changes. Stock symbols are in parentheses.

Cott Corp. (BCB CN) climbed 57 cents, or 3.8 percent, to C$15.67. The world's biggest maker of store-brand soft drinks was raised to ``buy'' from ``neutral'' by Kaumil S. Gajrawala at UBS AG in New York. The analyst wrote in a note that he believes Cott may be on the verge of a turnaround, thanks to plant closures and workforce reductions, and gains in market share and new customers.

Cascades Inc. (CAS CN) dropped 53 cents, or 3.9 percent, to C$13.20. The paper and packaging products company agreed to pay C$560 million ($491 million) in cash to rival Domtar Inc. (DTC CN) for the 50 percent of Norampac Inc. it doesn't own in their containerboard joint venture. Domtar rose 13 cents, or 1.6 percent, to C$8.35.

Jean Coutu Group Inc. (PJC/A CN) rose 66 cents, or 5.5 percent, C$12.62. Canada's second-biggest pharmacy chain said sales at its Canadian stores open at least a year rose 8 percent in November while sales at its U.S. outlets climbed 2.1 percent.

Synenco Energy Inc. (SYN CN) fell C$1.38, or 8.6 percent, to C$14.61. The tar-sands developer and its Chinese partner more than doubled the expected cost of the mining portion of their Northern Lights oil-sands project in Alberta to C$4.4 billion ($3.84 billion).

To contact the reporter on this story: John Kipphoff in Toronto at jkipphoff@bloomberg.net .

Last Updated: December 6, 2006 15:10 EST


Dividend Growth Investing Is Back In Favor

From Bloomberg:

How Dividend-Growth Funds Got Their Groove Back: Chet Currier

By Chet Currier

Nov. 28 (Bloomberg) -- Can I interest you in some blue chip stocks -- solid, long-established companies -- offering dividend yields of 6, 8 or 10 percent or more?

Sounds like a pie-in-the-sky proposition, especially in these yield-starved times. But no, it's the real deal.

The hitch is, it requires a long-term commitment of your money and it comes with no guarantees. You buy now, and you get the nice fat dividend payments later -- provided all goes reasonably well in the economy and the financial markets.

Welcome to ``dividend growth'' investing. There's nothing new about this way of managing money. Indeed, it takes us back to the fundamentals.

These days it is enjoying a new popularity among a generation of investors chastened by a bad experience in the late 1990s and early 2000s pursuing profits purely from stock price gains.

A search on my Bloomberg for the phrases ``dividend growth'' and ``rising dividends'' turns up six dozen mutual funds pursuing those missions. Some are long-established, like the $2.8 billion Franklin Rising Dividends Fund, which will soon celebrate its 20th birthday. In the past five years, according to my Bloomberg, the fund has gained 10.9 percent a year compared with 6.1 percent, including dividends, for the Standard & Poor's 500 Index.

Others are brand new, like the Vanguard High Dividend Yield Index Fund, which made its debut this month in both conventional mutual fund and exchange-traded fund formats.

Room at the Top

Some of these funds emphasize high current yields, while others may put the focus on dividend growth rates. Either way, all funds that invest in stocks for income offer the hope of increasing yields in the future.

On the evidence, increasing numbers of investors see that as one of the most promising avenues open to them to seek high income in their retirement years. For a glimpse into how this might work, consider the stock of General Electric Co.

GE happens to be one of Franklin Rising Dividends' 10 largest holdings. According to my Bloomberg, its current quarterly dividend of 25 cents a share gives an annual yield of about 2.8 percent at a recent stock price of around $36.

Now, 2.8 percent may look pretty skimpy. But the company has made a practice of raising the dividend regularly, and it has grown at a 9.4 percent annual rate over the past five years. By my rule-of-thumb calculations, if the dividend keeps growing at a 9 percent clip in the future it will double every eight years.

Looking Ahead

If I were 57 years old now and wanted to retire at 65, in other words, my yield then on GE stock bought today would be more like 5.6 percent. And I would have the hope that the yield would continue to increase in my retirement years, giving me some protection from rising medical costs and inflation.

The big word there, as you doubtless noticed, is ``hope.'' Nothing about the dividend is contractually promised, the way a bond-interest payment is. What I can count on for sure is that the stock price will bounce around all the while I own it, throwing a good scare into me every now and then.

With a mutual fund, I can avail myself of the valuable risk- management tool known as diversification. Even with a fund, of course, I am still exposed to the hazards of economic upsets, stock bear markets and so forth.

That's a price I have to pay to give myself a shot at a better yield down the road than I could lock up now in something guaranteed, like a Treasury bond or a bank certificate of deposit. These days, it must be noted, I can buy Treasuries and some other securities in an inflation-protected format. That is not the same thing, however, as the chance to participate in economic growth that comes with dividends.

Back to Basics

Whatever the future may hold, the revival of interest in dividends is a good and healthy thing. For a time, people began to look at stock investing as a game in which the price was derived from the action of the market itself, or from what somebody said about it.

That's pretty far removed from what really gives a stock its value. A share represents a small part ownership that gives me the right to participate in the company's power to earn money.

The way I gain access to those profits is through present and future dividend payments. If the stock price rises over time, it is because of an increase in the perceived amount of dividends that will or could be paid.

(Chet Currier is a Bloomberg News columnist. The opinions expressed are his own.)

To contact the writer of this column: Chet Currier in Los Angeles at ccurrier@bloomberg.net

Last Updated: November 28, 2006 00:05 EST


Friday, December 08, 2006

Microsoft: Interesting Trading Activity at End of Day Today

As noted by the website Ticker Sense, someone purchased 20 million shares of Microsoft (MSFT) at the close of trading Friday.

Buy Me Some Microsft And Make It Snappy!

What do you do on a quiet Friday afternoon if you have an extra billion dollars to burn? Well, why not take a flier on some MSFT. At the close today, 20 million shares traded driving the stock up 40 cents (1.4%). It’s hard to imagine why someone would need to get that much stock on their sheets before the weekend, but obviously there must have been a reason. Whether we’ll ever find
out is the question.


Source: Ticker Sense


Following is a six month chart for MSFT:


Personal Finance FAQ

On the free content portion of the American Association of Individual Investors, the site contains several articles on reaching retirement goals and common personal finance questions. One of the articles contained the following outline of personal finance questions:
The responses for each category are meant as guidelines. An investor should tailor a financial plan to fit their own goals and objectives.

One important outcome from the development of a financial plan is a road map for the construction of your investment portfolio. The target rates of return for ones investments should be to achieve specific asset level targets laid out in the financial plan. The investment performance, on a year to year basis, should be tied less to a specific market benchmark. The benchmark should be to achieve specific asset levels that are outlined in ones financial plan and not benchmarks like the S&P 500 Index.

Investment portfolios build around a foundation of dividend growth stocks allows an investor a higher probability of achieving the specific asset target levels since dividend growth equities tend to hold their value better in a down market. An important characteristic of dividend growth stocks is their lower volatility in down markets. Not that one should only manage their portfolio to not lose value, but in down markets, with withdrawals coming out of the portfolio, the future required return to get back to the original market value will be larger. For example, if the market is down 20% and withdrawals from the portfolio are 5% annually, to reach the prior years market value, one would need a return of approximately 33%.