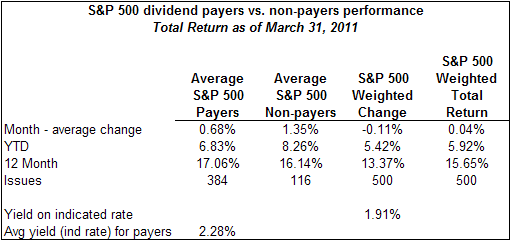
The equal weighted performance of the dividend payers in the S&P 500 Index trails the non payers through the first quarter of 2011, 6.83% versus 8.26%, respectively. For the 12-months though, the payers have a slight edge over the non payers, 17.06% versus 16.14%, respectively. The payers and non payers performance is calculated on an equal weighted basis and both are outperforming the market cap weighted S&P 500 Index for each of the time periods below.
 |
| From The Blog of HORAN Capital Advisors |
Source: Standard & Poor's

No comments :
Post a Comment