Wednesday, November 29, 2017

Strong Corporate Profit Picture A Key Component In Today's GDP Report

Included with today's second estimate GDP report by the Bureau of Economic Analysis is the preliminary estimate for third quarter corporate profits. The corporate profit measure is reported in several different formats, i.e. with and without inventory valuation and capital consumption adjustments. As I noted in a June post, more information on the adjustments can be found can be found in this BEA Briefing Paper (PDF).

The profit growth before tax and with the inventory valuation and capital consumption adjustments equaled 5.4% on a year over year basis. Without the adjustments, year over year profit growth equaled 10%. Importantly, NIPA profits have a nearly 1.0 correlation to IBES S&P 500 forward earnings and historically peak four quarters, or a year before the IBES forward earnings estimate. This preliminary corporate profit report is not signalling a peak in IBES S&P 500 forward earnings.


Also, with the preliminary corporate profit growth figure one can evaluate the NIPA P/E. The growth in NIPA corporate profits has resulted in a slight decline in the NIPA P/E as can be seen in the below chart. As I noted in the June post referenced above, what is useful with the NIPA profit measure is the fact it covers a larger earnings base for the U.S and covers more industries as it is not limited to public companies. Additionally, the NIPA figure makes an effort to adjust for the differing accounting measures being utilized by companies.


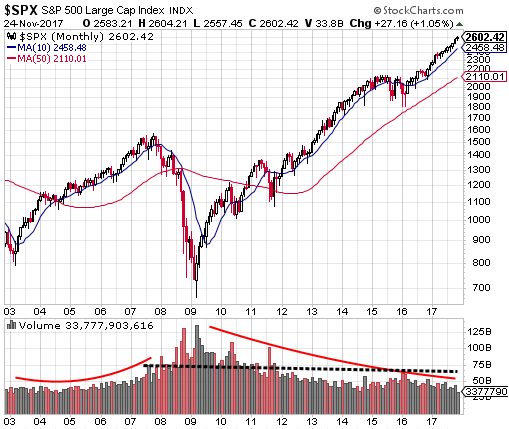
By reviewing some of my posts written over the past few months, the lack of any meaningful market pullback has been one recurring theme. However, with the continued strength exhibited in corporate profit growth, the market's path is certainly warranted as stock prices follow earnings. Also, the strong profit picture is beginning to result in a downtrend in the market's NIPA valuation, without a significant correction taking place. That does not mean high valuation equities will not correct more significantly, like what occurred in some technology stocks today. All in all, today's revision higher in Q3 GDP and the prelimnary profit report are both tailwinds for the economy and equity markets, all else being equal.


Tuesday, November 28, 2017

Soaring Consumer Confidence

Consumer confidence soared to a 17-year high in The Conference Board's report today. High levels of consumer confidence tend to translate to an improved retail sales environment as can be seen in the below chart. With consumers accounting for approximately 70% of economic (GDP) activity, today's confidence report portends a positive retail sales environment during the holiday shopping season.


On the other side of the coin though, The Conference Board's third quarter CEO Confidence measure was reported with a slight decline in early October as represented by the green line in the below chart. About two weeks ago we reported on the NFIB Small Business Optimism measure and it declined as well in its recent report; however, small business optimism remains at a high level.


Overall, confidence levels for business and consumers are at relatively high levels and this should be a tailwind for economic activity near term.


Sunday, November 26, 2017

The Sentiment Cycle Phase: "Buy The Dip"

Aside from fundamental market data, the equity market tends to follow a sentiment cycle as described by Justin Mamis, a famed market technician and author, who wrote several books on technical analysis. One of his books, The Nature of Risk, contains a discussion on the equity market's sentiment cycle. Below is The Sentiment Cycle chart included in The Nature of Risk.


In The Nature of Risk Mamis notes the market sentiment cycle begins with stocks climbing the proverbial "wall of worry." In a post I wrote in July 2009, Where Are We In The Market Cycle?, I noted the market seemed to be coming out of the financial crisis and had moved into this "wall of worry" phase of the sentiment cycle. Then in June of 2014 I noted in a blog post, VIX Is Low But Investors In Denial Stage Of Market Sentiment Cycle, I surmised the market was likely in the "denial" phase of the sentiment cycle. Today, I believe we are in or near the "buy the dip" phase of the market sentiment cycle.


One missing aspect with the market today is the lack of slowly increasing trading volume like occurred in the run up to the market top in 2008 and seen in the above monthly market chart. However, the lack of any significant market pullback since mid year 2016 is certainly representative of investors being content with "buying on the dips."

The sentiment cycle length seems to be an extended one in this bull market cycle and we can list any number of reasons for the extension. However, from a sentiment and technical perspective, this cycle, although long in duration, likely has further upside as buying "enthusiasm" seems absent. A confirming enthusiasm data point would be increasing volume into a so called blow off top.

Lastly, in Justin Mamis' last newsletter, he highlighted The Sentiment Cycle chart and had the following to say about it:
A cycle begins with stocks climbing “a wall of worry,” and ends when there is no worry anymore. Even after the rise tops out, investors continue to believe that they should buy the dips...Unwillingness to believe in that change marks the first phase down: “It’s just another buying opportunity.” The second, realistic, phase down is the passage from bullish to bearish sentiment...Selling begins to make sense. It culminates with the third phase: investors, in disgust,...dump right near the eventual low in the conviction that the bad news is never going to stop…
I think investors would have a hard time arguing against the fact that "buy the dip" is prevalent in recent stock market action. 


Saturday, November 25, 2017

Answering Market Questions Over Thanksgiving

In addition to receiving a few questions about Bitcoin from a few relatives over Thanksgiving, the other common question/comment was "can you believe this stock market, how long can it last." I confess I do not believe in market timing nor do I have a crystal ball; however, that does not mean one should put their head in the sand and ignore important market signals. Aside from the importance of monitoring weekly economic data reports, investors can review a couple of high level data points to gain perspective on the health of the economy and companies broadly. Just as earnings growth is important to evaluate at the company level, market level earnings are important as a rising tide may be lifting all boats. There is truth to the fact that stock prices have a tendency to follow earnings and that is clearly evident in the below chart.


Sunday, November 19, 2017

NFIB Small Business Optimism Index Highlights Tight Labor Market

Last week NFIB's October report on Small Business Optimism fell short of expectations, but remained at a high level at 103.8 versus 103 in the prior report. A few highlights from the report:
  • "The tight labor market got tighter for small business owners last month, continuing a year-long trend. Fifty-nine percent of owners said they tried to hire in October, with 88 percent of them reporting no or few qualified applicants."
  • "Consumer sentiment surged based on optimism about jobs and incomes, an encouraging development as consumers account for 70 percent of GDP," said NFIB Chief Economist Bill Dunkelberg.

And continuing to track the market's performance from December of last year (January's report) when NFIB reported one of the highest NFIB readings, the current S&P 500 Index return is outpacing prior market returns associated with high NFIB readings as seen in the below chart.


With a surge in consumer sentiment and a small business environment that is showing continued strength in hiring, these two factors alone should serve as a tailwind for the economy and market in the months ahead.


Saturday, November 18, 2017

Are Bearish Investor Sentiment Responses Translating Into Actual Action?

The S&P 500 Index is only down .60% from its November 8, 2017 high yet individual investor and institutional equity sentiment has turned significantly less positive. This negative sentiment has not translated into broadly lower equity prices though, but knowing sentiment measures are contrary indicators, they are approaching levels that would be suggestive of higher equity prices ahead.


Sunday, November 12, 2017

Equity Corrections Will Occur Again, Maybe Sooner Than One Expects

If there is one factor that perplexes me about the current market environment it is the lack of volatility since the election. The last time the market experienced a greater than 5% correction was in June of 2016 and the last double digit pullback was in February 2016. Going back to 1980 the average intra-year market decline for the S&P 500 Index is 14.1%. I have written a number of recent posts on the positive global economic environment, at the risk of sounding like a broken record, that may be serving as a tailwind for equity market returns around the world.

On the surface, if one knew mutual funds were holding elevated cash positions, they might conclude that this is a bullish data point since the cash can be deployed in additional equity investments. On the other hand, elevated liquidity in equity funds may be a sign of investors rapidly allocating more funds to equities and this might actually be a negative sentiment measure. In fact, as the below chart shows, there is a high correlation to elevated liquidity in equity funds and market tops.


Friday, November 10, 2017

If History Repeating; Another Five Years For Equity Bull Market

Shortly after the 2016 election in a post titled, Equity Market Beginning To Resemble Bull Market Of The 1950's And 1980's, I discussed how the equity market continued to trace a similar path as the market in the those two earlier decades. A part of my conclusion indicated the anticipated policies under a Trump administration would resemble policies implemented in the 1950's and 1980's, like tax reform and infrastructure spending. Reality is setting in and not much seems to be getting done in Washington on those two fronts; however, the current market continues to follow a similar path as in the 50's and 80's. Better sentiment and regulatory reform, even though by executive order, seems to be having a positive influence on companies. If the past is any guide then, the bull market might have at least another five years to run as can be seen in the below chart.


Thursday, November 09, 2017

Biases Influence Investment Decisions

Every investor makes investment decisions that are influenced by ones biases that form over time. These biases may come in many forms but they tend to fall into a couple of categories, emotional or cognitive. I mention this because it is not that uncommon that I sit down to write a blog post on a certain topic thinking the post's conclusion will go in one direction, but end up with a different conclusion after evaluating some of the research. Some of these blog topics are developed by flipping through a lot of charts, which I do frequently. One such chart is below and shows the relative performance of the S&P 500 Dividend Aristocrats to the S&P 500 Index.


Monday, November 06, 2017

Investment Opportunities Outside The U.S.

In a post yesterday I somewhat rhetorically titled the post wondering if the equity market was at a top. In short, I do not know, but offered suggestions for investors about reviewing their asset allocation vis-à-vis their spending needs.

Not all markets have traveled the same path as the S&P 500 Index though. A number of markets outside the U.S have lagged the U.S. since the end of the financial crisis. The below chart compares the cumulative performance of the S&P 500 Index (SPY) versus the MSCI ACWI ex U.S Index (ACWX). The chart goes back to the beginning of 1992 and clearly the S&P 500 has a performance advantage with a widening gap beginning to develop around 2011.


Sunday, November 05, 2017

Is This The Market Top?

I read an individual's commentary this weekend that was titled Is This As Good As It Gets, and I will have more comments on this later in this post, but it coincides with some clients/investors inquiring whether they should raise cash now. The 'raise cash now' question is certainly understandable when one looks at the strength of the market since the February low last year, up nearly 40% on a price only basis in less than two years.


Thursday, November 02, 2017

Individual And Investment Manager Sentiment Is Diverging

At the end of August bullish investor sentiment reached a year low of 25% and since that time individual investor sentiment has risen to 45.1% as reported by the American Association of Individual Investors (AAII) today. During this time period the S&P 500 Index has increased nearly 5%, providing some support to the contrarian nature of the individual sentiment report.


Conversely, the National Association of Active Investment Managers reported a decline in their Exposure Index to 60.2% from 71.7% in the week earlier. As noted by NAAIM, the Exposure Index,
"is not predictive in nature and is of little value in attempting to determine what the stock market will do in the future. The primary goal of most active managers is to manage the risk/reward relationship of the stock market and to stay in tune with what the market is doing at any given time. As the name indicates, the NAAIM Exposure Index provides insight into the actual adjustments active risk managers have made to client accounts over the past two weeks."

Nonetheless, investment managers are positioned for a less constructive bullish market while the individual investor seems more optimistic from a sentiment perspective. One should keep in mind these sentiment measures are most predictive at extremes and it can be argued neither the AAII sentiment reading nor  the NAAIM Exposure Index is at an extreme level. However, sentiment expectations for institutions and  individuals are moving in opposite directions and both will not be right.


Sunday, October 29, 2017

The Time Period Matters For Outperformance: High Beta Versus Low Volatility

I have read commentary over the last few days noting the outperformance of the PowerShares High Beta Index (SPHB) versus its counterpart, the PowerShares Low Volatility Index (SPLV) over the past 1-year time frame. However, much of this outperformance was generated in the couple of months following the November election.


Saturday, October 28, 2017

Sizable Declines In A Few Individual Stocks; Time To Review Allocations

Much is going right as it relates to the equity markets around the globe; however, this past week saw the market punish companies that reported earnings that did not match market expectations. The below 2-week chart only lists a few of those companies, but companies like Celgene (CELG) down 28.1% and Expedia (EXPE) down 17.5% suffered much of their losses on one or just a few trading days.


Sunday, October 22, 2017

An Increasing Dividend Payout Ratio Is A Positive Indicator For The Market

Admittedly, in an equity market run investors are currently experiencing, i.e., the second longest run without a 20% pullback, a common theme that continues to seep into ones thinking, including mine, is when is the market going to experience a bear market correction of 20% or more. Even a double digit pullback is a scarcity as the below chart of the S&P 500 Index shows. The last double digit pullback occurred in February of 2016.


Sunday, October 15, 2017

Citgroup Economic Surprise Indices Have Little Bearing On Equity Market Performance

One set of indices that seems to cycle from positive to negative over a relatively short period of time are the Citigroup Economic Surprise Indices (CESI). This aspect of these indices means they gain prominence from a commentary standpoint when they reach high and low points. What is important for investors to know is the CESI is a mean reverting index, that by design, cycles between highs and lows over relatively short periods of time. In June of this year, the Citigroup U.S. Economic Surprise Index (CESI-US) was a minus 78 after falling from plus 57 in March. At the June low some commentary began noting the U.S. economy might be headed for a recession. However, the correlation of the S&P 500 Index to the CESI-US is a small negative .04, so actually a slight negative correlation between the two variables.


Saturday, October 14, 2017

Synchronized Global Growth

Much of the sentiment and global market data continues to come in on the positive side of the ledger. Friday's University of Michigan Consumer Sentiment jumped six points to 101.1 for October and is the highest reading in thirteen years. As reported by Econoday, "The expectations component is up nearly 7 points to 91.3 with the component for current conditions posting a nearly 5 point gain to 116.4."


In reviewing the Global PMI's for Manufacturing, as of the end of September, the below table shows all of the PMIs are in excess of 50 which suggests improvement versus deterioration in the manufacturing sector. PMI's are leading indicators with health in the manufacturing sector providing insight into sales, employment, etc. The common surveyed questions center on new orders, manufacturing output, employment, suppliers' delivery times and inventory.


The positive sentiment and economic data has translated into positive equity market returns around the world. All of the 45 country Exchange Traded Funds (ETFs) at the following link are showing positive returns year to date through October 13, 2017.

The economy is not the market and vice versa; however, the positive sentiment and positive economic data currently being reported is translating into higher equity market prices. The lack of market volatility is certainly something that will not persist forever. Maybe the Fed's desire to reduce its balance sheet will result in higher equity market volatility. A correction or pullback near term would be healthy, noting the average intra-year pullback is just over 14%.


Tuesday, October 10, 2017

A Decline In Small Business Optimism

Today, NFIB reported the September Small Business Optimism Index results and they showed the Index fell 2.3 points to 103, which was below the lowest consensus forecast. In spite of the decline, the index remains at a high level as can be seen in the below chart.


Monday, October 02, 2017

Fall 2017 Investor Letter: The Hated Rally Continues

Our Fall 2017 Investor Letter has a music lyrics theme to it and since we have an age-diverse team as it relates to the employees of HORAN Capital Advisors so goes the taste in music for our colleagues as readers of the newsletter will find out.  As Chuck Prince, former chairman and CEO of Citigroup, said almost a decade ago,  "As long as the music is playing, you got to dance." This seems to be one of those markets where the music just doesn't seem to stop and just maybe has resulted in one of the most hated equity market rallies in some time.


The Fall 2017 Investor Letter touches on a number of topics, including the unwinding of the Fed's balance sheet, low interest rates and the negative impact on income generation for investors and the benefit achieved by investors that have pursued diversification outside of the U.S. equity market.

For additional insight into our views for the market and economy, see our Investor Letter accessible at the below link.


Thursday, September 28, 2017

Shifting Investor Sentiment

It seems the market's consistent bid to move higher this year might be confusing the individual investor. That is, the fact the market has escaped any material pullback this year may be weighing on consumers in that they are prepared for or expect a pullback. As the below chart shows, the market has avoided such a pullback of more than 3% so far this year.


This lack of volatility has not translated into a bullish individual investors though if the American Association of Individual Investors Sentiment Survey is a guide. This week's sentiment report shows bullish sentiment declined almost seven percentage points to 33.3%. Most of this decline showed up in an increase in the neutral reading with a 5.3 percentage point increase to 37.9%.


With the strength of this year's market return that actually began in February of last year, one would expect the individual investor to be bullish on equities. Remembering the sentiment reading is a contrarian one, high bullishness readings can be a negative for future equity prices. Excessive individual investor bullish is certainly not the case at the moment if the survey readings are to be believed.