Showing posts with label Technicals. Show all posts

Sunday, December 06, 2020

Broadening Equity Market Participation

It seems a broad range of equity indices are hitting new all time highs every day and some investors question whether this can continue. The S&P 500 Index closed at an all time high Friday, December 6, bringing its year to date return to 14.5% on a price only basis. In earlier posts I discussed the roller coaster ride of the market as it traversed the coronavirus shutdown and reopening. The S&P 500 Index fell 33.9% from February to March and has bounced higher by 65.3% from the March 23 low. And since the election in early November, the S&P 500 Index is up 12.5% with only one of the five weeks down a fractional .76%.


Sunday, August 02, 2020

VIX/VXV Level Warrants Investor Attention

July's return for the S&P 500 Index of 5.64% pushed the index into positive territory for the year, returning 2.38% year to date. More impressive is the S&P 500's return since the March 23 low at +46.2%. It is hard not to agree there appears to be an upward bid to the equity market in spite of concerns around the virus induced weakness in some of the economic data, especially in the jobs/employment data. In my last post I wrote about the AAII Sentiment Survey and concluded the market seems to be climbing a wall of worry given the low level of bullishness being expressed by individual investors.


Friday, July 10, 2020

Mutual Fund And ETF Flows Don't Favor Stocks

As is said from time to time, a picture is worth a thousand words and one simply needs to look at mutual fund and ETF flows to see the truth behind the statement. Investors' actions indicate stocks have not been at the top of their buying list for a year and a half. As the top two panels in the below chart show, cumulative mutual fund and ETF flows for stocks have been decidedly negative for a year and a half.


Monday, April 27, 2020

Retest The March Low Or Not

The economic and equity market environment investors find themselves operating in today are different and more challenging than any environment they have likely faced in their lifetime. The steep market contraction from the February high was swift, i.e., declining 33.9% over a short 22 trading days, the fastest on record. With a nearly global economic shutdown due to mandatory stay at home orders, the economic growth rate, or should I write, contraction, is turning out to be severe. The CBO's estimate of U.S. second quarter GDP is for a contraction of nearly 40% at an annual rate. Over 26 million jobs have been lost in five short weeks, wiping out the job gains that were generated following the financial crisis of 2008/2009. So in the face of this poor economic data, will the equity market retest the March 23 low?


Monday, April 20, 2020

The Current Market Like 1987 Or 2008/2009?

Investors and the market are entering peak earnings season and with futures down this morning, it seems investors may be facing a buy the rumor sell the news type of market. The crash in oil prices, with NYMEX crude down 35% to $11.77 per barrel, is adding to the negative market sentiment. Up until this peak earnings period for the first quarter, the S&P 500 Index rose over 28% off the March 23 low as of Friday's (4/17/2020) close. The speed of the market decline from February and the subsequent speed of the move higher seems at odds with the business environment facing companies. As is often said, the market is not the economy. Investors are now faced with answering the question of where the market is headed from here.


Tuesday, April 14, 2020

Retest The Low Or Onto New Highs?

Of course March 23 is not even a month in the rear-view mirror, but the S&P 500 Index is up over 23% since the low on that date. Some have commented the market will retest that market low before achieving new highs while others say the Fed's intervention minimizes the likelihood of a retest. As time moves further past the March 23 day, it seems "the no retest" chorus is sounding more probable. Because I have a bit of a contrarian tilt in my viewpoints, maybe the no retest sound bite means just the opposite?


Thursday, March 12, 2020

Are We There Yet?

Some are equating the current market decline to the equity market decline that occurred in October 1987. Urban Carmel, who writes at The Fat Pitch highlighted in commentary on Twitter, the market's action in 1987:
  • "the S&P 500 Index fell 20% in one day, rose 15% the next 2 days, then returned to the low the following week."
  • "then rose 15% again and retested the original low 6 weeks later,"
  • "and finally the S&P 500 Index was up 25% a year later and back at prior highs 2 years later."
So what does that look like compared to today's market and has it arrived at a bottom? 


Thursday, March 21, 2019

Equity Inflows Now Turning More Positive As Equity Returns Near A Peak?

The Investment Company Institute releases fund flow and ETF net issuance data on Wednesday's with a one week lag. In Wednesday's report for the week ending March 13, 2019, ICI reports domestic equity inflows spiked to $12.8 billion. This represents the largest weekly inflow since March 20, 2018 when domestic equity inflows totaled $19.1 billion.


Saturday, March 09, 2019

Investors Have Missed Out On The Equity Rally

From 2014 to mid-2015, investors seemed to have a favorable view on stocks if one bases the observation on ETF and mutual fund flows. As the below chart shows, the increase in S&P 500 Index until mid-2015 coincided with positive flows into domestic equity focused mutual funds and ETF's. Beginning in mid 2015 though, investor flows turned negative (maroon line.) During late 2016 and early 2017 the cumulative maroon line became less negative indicating positive flows into domestic equities, but the sharp rally from 2017 to the market's peak at the end of the third quarter of 2018 was not supported by positive domestic equity flows. In fact, domestic equity flows have been negative to the tune of -$1.5 trillion over this five plus year period.


Wednesday, February 06, 2019

Higher U.S. Stock Prices Not Driven By Higher Domestic Equity Inflows

The end of 2018 saw the S&P 500 Index return decline over 13% as seen in the first chart below. The second chart shows the snap back in the market that has rewarded investors at the start of 2019 with the price only return of the S&P 500 Index up nearly 9%.


Sunday, December 09, 2018

Investment Fund Outflows Dominate

The most recent flow data for ETF's and mutual funds reported by ICI last week notes outflows occurred in nearly all of the broad asset categories. One exception was a small positive flow into commodity oriented investments.

 Source: ICI


Thursday, November 22, 2018

Low Level Of Bullishness Means Equity Market Bottom Maybe Near

Investor sentiment continues a trend of turning less bullish. Today's Sentiment Survey report from the American Association of Individual Investors noted individual investor bullish sentiment decline 9.8 percentage points to 25.3%. Neutral sentiment declined 1.3 percentage points with the result that bearish sentiment rose 11.2 percentage points. The net result is the bull/bear spread of -21.8 pp is the widest since the spread reached -29 pp in February 2016.


Tuesday, October 23, 2018

VIX Curve Moving Back Towards Contango A Positive For Stocks

The level of the VIX is one measure to gauge fear in the equity markets. When the near term VIX index is trading at a higher level than the VIX further in the future, for example, the 3 month VIX (or ticker VXV), then the VIX curve is said to be in backwardation. This is not the normal structure for the VIX curve as the VIX curve is usually in contango, meaning prices in the distant future are higher than those nearer term. For equity market volatility, i.e. the VIX, this makes sense as volatility inducing events are less predictable in the distant future versus today thus, the future VIX should be at a higher level than the near term VIX. As the below chart shows, in instances where the near term VIX is higher or significantly greater than one, this tends to occur near equity market bottoms.


As the near term VIX begins to decline or fall below the future VIX or VXV, the equity market tends to move higher. This process can take place over a several week period, but nonetheless, the equity market does tend to bottom 'near' spikes in backwardation. The recent spread between the VIX and VXV of 3.4 may have marked a near term peak in backwardation. If this is the case, the equity market may be setting the stage for a rally into year end.


Monday, October 22, 2018

Many Individual Stock Returns Are In Correction Territory

On a price only basis the S&P 500 Index remains up 3.08% year to date and up 4.66% on a total return basis. As the following chart does show, the S&P is off its late September high by 6.54%.


Sunday, September 16, 2018

Instilling Fear In Investors Via Charts

In the mid 1990's famed investor Peter Lynch stated, "Far more money has been lost by investors in preparing for corrections, or anticipating corrections, than has been lost in the corrections themselves." With this quote in mind it seems a number of investment pundits are once again trying to sell fear regarding the current equity market. This morning I ran across the following chart on Twitter.


Wednesday, August 22, 2018

Yet To Break The Bull Market Record

I have been a bit lax in writing blog posts as client and investment responsibilities have taken precedence. On a day like today though, I feel compelled to type out a blog post recognizing today's record breaking bull market, or is it?


Wednesday, June 06, 2018

One Chart Will Not Predict The Next Recession

I had the fortune to read an article yesterday, Uh-oh: Unemployment Falls Below 4%, that noted,
"On each occasion that the unemployment rate sank beneath 4%… recession was soon on tap. To remind, it now rests at 3.8%. But why should recession rapidly follow peak employment?"
The article included the below chart and provided several reasons that would seem to justify the fact a recession is near when the unemployment rate is below 4%. Often times these scary or miracle charts are highlighted in an attempt to scare investors out of the market.


Monday, April 02, 2018

A More Challenging But Normal Equity Market

Before I left for a week of vacation at the end of March, the equity markets had begun to exhibit a higher level of volatility. This seems to occur more often than not around this time period each year. This heightened volatility was to the downside and I wrote a post before leaving town noting this was more typical market action. What has been so abnormal about the equity market over the past five years is the fact nearly every calendar quarter since 2013 has generated a positive return. As the below chart shows, prior to 2013, this was certainly not the case.


Sunday, November 26, 2017

The Sentiment Cycle Phase: "Buy The Dip"

Aside from fundamental market data, the equity market tends to follow a sentiment cycle as described by Justin Mamis, a famed market technician and author, who wrote several books on technical analysis. One of his books, The Nature of Risk, contains a discussion on the equity market's sentiment cycle. Below is The Sentiment Cycle chart included in The Nature of Risk.


In The Nature of Risk Mamis notes the market sentiment cycle begins with stocks climbing the proverbial "wall of worry." In a post I wrote in July 2009, Where Are We In The Market Cycle?, I noted the market seemed to be coming out of the financial crisis and had moved into this "wall of worry" phase of the sentiment cycle. Then in June of 2014 I noted in a blog post, VIX Is Low But Investors In Denial Stage Of Market Sentiment Cycle, I surmised the market was likely in the "denial" phase of the sentiment cycle. Today, I believe we are in or near the "buy the dip" phase of the market sentiment cycle.


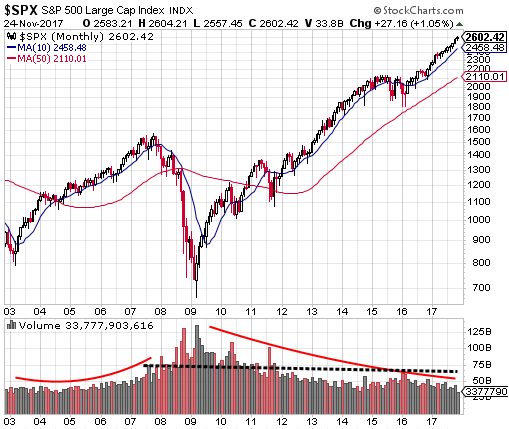
One missing aspect with the market today is the lack of slowly increasing trading volume like occurred in the run up to the market top in 2008 and seen in the above monthly market chart. However, the lack of any significant market pullback since mid year 2016 is certainly representative of investors being content with "buying on the dips."

The sentiment cycle length seems to be an extended one in this bull market cycle and we can list any number of reasons for the extension. However, from a sentiment and technical perspective, this cycle, although long in duration, likely has further upside as buying "enthusiasm" seems absent. A confirming enthusiasm data point would be increasing volume into a so called blow off top.

Lastly, in Justin Mamis' last newsletter, he highlighted The Sentiment Cycle chart and had the following to say about it:
A cycle begins with stocks climbing “a wall of worry,” and ends when there is no worry anymore. Even after the rise tops out, investors continue to believe that they should buy the dips...Unwillingness to believe in that change marks the first phase down: “It’s just another buying opportunity.” The second, realistic, phase down is the passage from bullish to bearish sentiment...Selling begins to make sense. It culminates with the third phase: investors, in disgust,...dump right near the eventual low in the conviction that the bad news is never going to stop…
I think investors would have a hard time arguing against the fact that "buy the dip" is prevalent in recent stock market action. 


Friday, November 10, 2017

If History Repeating; Another Five Years For Equity Bull Market

Shortly after the 2016 election in a post titled, Equity Market Beginning To Resemble Bull Market Of The 1950's And 1980's, I discussed how the equity market continued to trace a similar path as the market in the those two earlier decades. A part of my conclusion indicated the anticipated policies under a Trump administration would resemble policies implemented in the 1950's and 1980's, like tax reform and infrastructure spending. Reality is setting in and not much seems to be getting done in Washington on those two fronts; however, the current market continues to follow a similar path as in the 50's and 80's. Better sentiment and regulatory reform, even though by executive order, seems to be having a positive influence on companies. If the past is any guide then, the bull market might have at least another five years to run as can be seen in the below chart.