Sunday, August 30, 2015

Stocks Higher 10-Years From Now

Before the onset of the market weakness in the early part of last week and the end of the prior week, S&P Dow Jones Indices released a report highlighting rolling 10-year annualized returns for the S&P 500 Index. The report seems prompted by a response Warren Buffett made to a question on timing the market. Buffett noted he was not a market timer and simply responded, "Stocks are going to be higher, and perhaps a lot higher, 10 years from now. I am not smart enough to pick times to get in and get out."

In the report, S&P notes,
  • "Since 1947, the S&P 500’s price return was up in 72% of calendar years. Add in dividends reinvested and that batting average jumped to 80%."
  • "And if one is worried that the S&P 500 has gone too far since the conclusion of the 2007-09 mega-meltdown bear market, consider that the rolling 10-year CAGR through Q2 2015 was +7.9%, nearly 400 basis points below the long-term average."
  • "...there have been times when things didn’t work out too well for investors, but these times were few and isolated. Of the 278 quarters of rolling 10-year CAGRs from Q1 1946 through Q2 2015, only eight were negative, and they all occurred between Q4 2008 and Q3 2010."
From The Blog of HORAN Capital Advisors

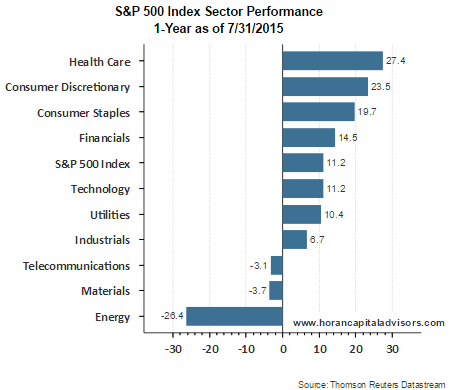
The S&P report contains additional detail on sector returns going back to 1990 and investors should find the entire report a worthwhile read. One sector highlight noted in the report is the fact, "...each sector recorded very high monthly 10-year CAGR batting averages, or frequencies of positive observations, from 100% for consumer staples, energy, materials and utilities, to 79% for telecom services and 67% for financials. The S&P 500’s average was 87%."

In short, timing the market can be a difficult endeavor for many investors, Last week's heightened market volatility is an example of this, especially for those who sold out of stocks on Tuesday.

Source:

The Wisdom of Warren
S&P Dow Jones Indices
By: Sam Stovall, U.S. Equity Strategist
August 17, 2015


Thursday, August 27, 2015

Equity Market Recovering Like October 2014

On Tuesday I wrote about the bulls waiting for that elusive equity market bounce. The wait was short as the market snap back over the last two days qualifies for that bounce. Investors are likely contemplating the market's direction from here.

A "V-type" pattern seems to be forming just as the market traced out late last year. As the below chart shows, the contraction from July to October of 2014 was not as severe as the one being experienced at the moment and took longer to develop. What is interesting is the pace of this bounce back seems to be occurring just as quickly as the one last year.

From The Blog of HORAN Capital Advisors


Tuesday, August 25, 2015

Awaiting The Elusive Equity Market Bounce That Holds

The stock market bears have been calling for this current pullback for what seems like years. Now the bulls are looking for the elusive bounce that "holds" and signals another move higher in the market. After the close on Friday, I noted the oversold market conditions and a potential bounce that may follow. Three days into this potential "bounce" scenario, the market has failed to cooperate. This shows how difficult it is to time the market and find market bottoms. Nonetheless, the bears have had years predicting a correction, so for one calling a bounce for a few days (and being wrong) should be given a little leeway.

After today's trading action, with the waterfall decline near the close, much technical damage was done to the market. On the positive side, market conditions are at extreme oversold levels. As the below chart shows, the relative strength index (RSI) reached an oversold level of 16.77. The only lower level for the RSI over the past five years occurred in August 2011 when the RSI reached 16.46 and was followed by a sustained bull market run.

From The Blog of HORAN Capital Advisors

The percentage of S&P 500 stocks trading above their 50 day and 200 day moving averages continue to indicate oversold market levels as noted in the two charts below.


Monday, August 24, 2015

Bears Awaken From Worst Nightmare

With today's market close the S&P 500 Index and the Dow Jones Industrial Average both are in correction territory, down 10+%. The S&P 500 Index is down 11.15% from its closing high on 5/21/2015 and the Dow Jones Industrial Average is down 13.33% from its closing high on 5/19/2015. It is safe to say the bears have awakened from their worst nightmare as the markets moved higher, nearly unabated, for four consecutive years until this past week. It is safe to say the market is in an extreme oversold position after today's trading activity. Nearly 90% of the stocks (444 issues) that comprise the S&P 500 Index are in correction territory, i.e., down 10+% from their 52-week highs. As we noted in a post this weekend, this figure stood at 70% after Friday's close, so more technical damage was done today.

With today's close, only 8% of S&P 500 stocks are trading above their 50 day moving average as noted in the first chart below. This low percentage was last reached in August 2011 at a time the government's credit rating was lowered to AA+ from AAA by Standard & Poor's. The second chart shows the percentage of S&P 500 issues trading above their 200 day moving average and this stands at 20.8%, again near a level last reach in August 2011.

From The Blog of HORAN Capital Advisors

From The Blog of HORAN Capital Advisors

Another indication of potential excess fear in the markets is the level of the VIX Index. Today, the VIX spiked higher to 40.74. More insight into the VIX can be found in our article post from late 2011 titled, Fearful Investors.

From The Blog of HORAN Capital Advisors

As I write this post the Shanghai Index is down over 6%, while the S&P 500 Index Futures Index is up almost 2%. Yes, there are challenges in the emerging markets, but we continue to believe developed Europe and the U.S. economies can withstand the impact of weaker emerging economies. Truth be know, China's historical growth has probably been much overstated for the past year and a half and developed economies have continued to experience economic growth, albeit slow growth. Now is likely a good time to follow Warren Buffett's often repeated quote, "Be Fearful When Others Are Greedy and Greedy When Others Are Fearful." The market action over the course of the last few days may not have shaken out all the weak hands; however, some markets and stocks are now trading at fairly attractive prices and valuations. No one can predict exact market bottoms, but the markets may be near a level where the bear trap shuts.


Sunday, August 23, 2015

Nearly 70% Of S&P 500 Stocks In Correction Or Bear Market Territory

Last week's market pullback did not spare too many equities from the draw down. As of the close on Friday, 30.3% (152 issues) of S&P 500 stocks are now down greater than 20% from their 52-week highs and another 39.0% (196 issues) are down between 10% and 20% from their 52-week highs. In total nearly 70% of stocks are in correction or bear market territory. Below is a table noting this breakdown.

From The Blog of HORAN Capital Advisors

For those investors seeking to deploy cash, below is a table and link to those stocks mentioned above. Some of these stocks are rightfully down due to fundamental business issues. However, with in depth research, some of the equities may offer investors attractive entry points to begin building long equity positions.

From The Blog of HORAN Capital Advisors


Saturday, August 22, 2015

VIX Futures Curve In Backwardation, Indicative Of A Near Term Market Bounce?

With Friday's market sell off, the VIX curve went into steep backwardation at 4.56. VIX backwardation refers to the situation when the near-term VIX futures are more expensive than longer-term 3-month VIX futures (VXV). This is an indication traders expect volatility in the future to be lower than it is now. Historically, when this occurs, short term market rallies tend to result from this technical event. In addition to the VIX backwardation, I noted other overly bearish technical indicators in our post yesterday, Oversold Technical Indications, Market May Be Due For A Bounce. In total, these bearish sentiment levels are viewed as contrarian signals.

From The Blog of HORAN Capital Advisors


Friday, August 21, 2015

Oversold Technical Indications, Market May Be Due For A Bounce

The market action on the last two days of this week was not kind to equity investors. The Dow Jones Industrial Average closed down 530 points today and closed the week in correction territory, i.e., down 10% from its May high. The S&P 500 Index has not reached correction territory though, down 7.5% from its closing high on May 21st.

From The Blog of HORAN Capital Advisors

The pullback this week in the S&P 500 Index and the Dow has resulted in oversold market conditions that historically have resulted in a subsequent market bounce. The equity put/call ratio closed today at 1.04 and levels above one are indicative of overly bearish market sentiment.
The equity P/C ratio tends to measure the sentiment of the individual investor by dividing put volume by call volume. At the extremes, this particular measure is a contrarian one; hence, P/C ratios above 1.0 signal overly bearish sentiment from the individual investor. This indicator's average over the last 5-years is approximately .635 indicating the individual investor has been generally mostly bullish and more active on the call volume side.

From The Blog of HORAN Capital Advisors

Another indication the market is oversold is the percentage of stocks trading above their 50 and 200 day moving averages. Both of these measures show the extent of the weakness in the market. The 200 day moving average is approaching levels last reached during the fiscal cliff period/sell off in the later half of 2012.

From The Blog of HORAN Capital Advisors

From The Blog of HORAN Capital Advisors

We noted in articles in April and May of this year that those smaller pullbacks at that time were not likely the beginning of a correction. Activity this week certainly qualifies for that correction.

The dog days of summer are now showing their colors. The question for investors is whether this pullback is one that will extend into a bear market, i.e., down 20%. This is difficult to predict; however, we do believe economic activity in the U.S. and in developed markets outside the U.S. continue to show growth, albeit slow.
  • The weakness seen in emerging markets along with their currency depreciation policies, certainly are of concern. We do not believe a full blown currency war occurs as this will benefit no country.
  • Japan's growth has fallen below expectations and this is in spite of a massive QE program being pursued by the Bank of Japan.
  • From an economic cycle perspective it has been some time that the U.S. economic cycle has been out of sync with foreign economies. The Fed wants to increase rates if for no other reason than to have fire power available if needed down the road. Many developed overseas markets, especially the euro zone, have just recently embarked on a QE strategy in an effort to stimulate growth. This will keep euro zone interest rates down at a time the Fed is trying to move our rates higher. This would result in a further strengthening of the US Dollar versus the Euro. A strengthening Dollar will continue to pressure multinational company earnings/sales.
  • The laser focus on the Fed's rate policy is also creating market uncertainty. We do not see specific economic data points that suggest the Fed should increase rates. The corner the Fed is in at the moment is the fact rates should have never been left this low for this long. The sooner the rate increase occurs, probably the better for the market looking 12-months out.
The sideways action for the markets for the better part of this year has culminated in quite a bit of technical damage to a broad basket of stocks and the indices themselves. Repairing this technical damage does not occur overnight. On the other hand, many individual stocks are in bear market territory and maybe this week's market action provides an opportunity to begin deploying excess cash. It is difficult to predict market bottoms though.


Wednesday, August 19, 2015

High Beta Underperforming Low Volatility

As the market continues to trade sideways in its, seemingly, directionless trade, it is helpful to observe various intermarket relationships and technical indicators to see what exactly is driving returns and to check-up on the overall health of the market.  One interesting dynamic of the market this year is the underperformance of high beta stocks in relation to low volatility stocks.  In a typical bull market, high beta stocks outperform as market psychology shifts to a “risk on” mindset where cyclical companies (such as high beta and high growth stocks) are favored over non-cyclical companies that provide lower, more protected exposure.  This has not been the case this year.  High beta stocks have underperformed low volatility stocks measured by the ratio of the performance of the S&P 500 High Beta ETF (SPHB) over the S&P 500 Low Volatility ETF (SPLV).   As the ratio moves higher, high beta is outperforming low volatility and as the ratio moves lower, low volatility is outperforming high beta.

From The Blog of HORAN Capital Advisors

The performance dispersion can partially be explained by the difference in sector weighting of these two ETFs.  Given SPHB's high beta, cyclical tilt, overweights in Energy and Industrials have been a big drag on performance.  Conversely, SPLV has no Energy exposure and higher weightings to Consumer Staples and Health Care, two sectors that traditionally carry lower volatility and have outperformed the broader market this year. These are a few examples of why the low volatility strategy is outperforming not only high beta names this year, but has also caught up to the S&P 500.

From The Blog of HORAN Capital Advisors

This being said, it is interesting to note that growth stocks are still outperforming value stocks in the same time period, shown by the relationship between the S&P 500 Growth ETF (IVW) and the S&P 500 Value ETF (IVE).

From The Blog of HORAN Capital Advisors

While this is not a new dynamic to this bull market,  the amplified disparity in performance since the end of June is noteworthy as investors continue to favor companies with higher growth rates in this slow, bump along environment. High beta stocks may reverse trend and outperform the low volatility strategy should the market resume a trend to new highs, but until then, low volatility is in play.


Tuesday, August 18, 2015

Some Market Technicals Looking More Bullish

When looking back to mid-October of last year, the S&P 500 Index has enjoyed a nice move higher from the mid October 2014 pullback: up 12.9%. However, since the beginning of March the S&P 500 Index has traded sideways within a range from around 2,044 to 2,130 and is down fractionally since March 2nd.

Since the October pullback, the Accumulation Distribution Line has manged to trend higher yet moving sideways since March. Since July though, the ADL is moving higher again. The full definition of the ADL can be found here, but contains a Money Flow Multiplier. Briefly, the StockCharts.com website contains the following summary,
"The Money Flow Multiplier fluctuates between +1 and -1. As such, it holds the key to the Money Flow Volume and the Accumulation Distribution Line. The multiplier is positive when the close is in the upper half of the high-low range and negative when in the lower half. This makes perfect sense. Buying pressure is stronger than selling pressure when prices close in the upper half of the period's range (and vice versa). The Accumulation Distribution Line rises when the multiplier is positive and falls when the multiplier is negative."
From The Blog of HORAN Capital Advisors

The On Balance Volume (OBV) indicator continues to trend lower and OBV adds a period's total volume when the close is up and subtracts it when the close is down. A cumulative total of this positive and negative volume flow forms the OBV line. The trend is important in this line as well and maybe the OBV is beginning to turn higher as well.

In summary, the rising ADL is an early indicator that the market may be nearing a bullish reversal. As the above shows, market volume on down days has been trending lower while volume on up days has been trending higher. There remains technical resistance to the upside; however, if the market can manage to continue making higher highs and higher lows, the S&P 500 Index may break to the upside and out of this protracted sideways trading range.


Friday, August 14, 2015

Market Volatility In Perspective

It seems easy to forget what equity returns were like following the financial crisis in 2009. The significance of the contraction has certainly remained forefront in investors' minds. Just looking at the below chart reminds one of the damage done to portfolio values through this time period. At its worse, the 1-year return for the S&P 500 Index was negative 48.8% looking back from March 5, 2009. Almost exactly one year later, the 1-year return for the S&P 500 was 68.6% as of March 9, 2010. This type of volatility is not what investors like to experience or expect.

From The Blog of HORAN Capital Advisors

Notable in the above chart is the fact the returns for the 1-year rolling periods is trending lower as can be seen on the chart between the red and green resistance and support lines above. We do believe there is a high probability that equity returns, over the next three or so years, will be more muted in the mid to high single digit range.  With this potentially lower return environment, all else being equal, lower market volatility could persist as has been the case for the past few years and noted below.

From The Blog of HORAN Capital Advisors

A part of this lower return expectation is the fact we do believe a more neutral Fed Funds rate might be lower than the neutral level historically. If a neutral Fed Funds Rate is in the 2 - 3% range, it is not a stretch to expect equity returns to be in the high single digits from an equity risk premium perspective.


Anticipating The Rate Hike

For historically good reasons investors get fixated around Federal Reserve policy changes that lead to changes in the direction of interest rates. These interest movements provide investors with insight into the Fed's perspective on the economy. In short, in an overheating economy, the Fed will push rates higher in an effort to contain potential inflationary pressures. In an economy that is weakening, the Fed lowers rates in order to establish an environment that will stimulate economic growth.

In the past we have written that an increase in interest rates is not necessarily a negative for stock returns. This has especially been the case when rates are increased at levels below 4%. The thinking is a rate increase at this time is the Fed's desire to get rates back to a more normal level to have a tool at their disposal in the event there is some type of economic shock to the system. When rates are increased beyond 4%, this generally is a signal by the Fed it desires to slow economic growth to contain inflationary pressures and this is the point in time that rate increases can be a negative for stock price returns.

So we sit here today and investors/strategists seem to have heartburn around an impending rate increase. However, as the two charts below show, stocks actually move higher in tandem with a rising Fed Funds Rate (yellow line).

From The Blog of HORAN Capital Advisors

From The Blog of HORAN Capital Advisors

Source: Andrew Todd

As the above chart does show, at the initial onset of a rate hike, the market does tend to be more volatile and trend lower for a brief period of time. Over the course of the cycle, however, the equity market is positively correlated to the higher rate moves.

I do understand the concern about a rate hike at this point in time: emerging market slowdown, stronger dollar and its short term negative impact on exports, but, a rate hike of 25 basis points from this starting point should not have a huge negative impact to the market and the economy. The Fed should probably initiate the initial increase to remove investor fixation on this issue.


Thursday, August 13, 2015

Better Investing Members' Most Active Stocks As Of August 13, 2015

It has been several months since I last provided readers with an update on the most active stocks from Better Investing members. At the top of the list is Apple (AAPL) which has been a favorite of Better Investing members for a number of months running. New to the list since I list provided an update is Ambarella Inc. (AMBA), Southwest Airlines (LUV) and Starbucks (SBUX).

From The Blog of HORAN Capital Advisors

Disclosure: Firm long QCOM, AAPL


Thursday, August 06, 2015

Negative Investor Sentiment Abounds

The S&P 500 Index is down 2.2% from its late May high, up 1.2% year to date, and yet, up 9.1% over the last year and investors are becoming more concerned about an imminent correction in the stock market. The concern is certainly understandable given the fact the market is nearing four years since the last 10+% correction. This concern has translated into and equity put/call ratio that continues to rise towards levels indicative of an oversold market. An oversold market and only down 2.2%? The below chart shows the CBOE Equity P/C ratio closed at .82 today. Levels above 1.0 are most predictive of overly bearish sentiment and where markets have the propensity to rally.

From The Blog of HORAN Capital Advisors

Some market technicians prefer to look at the 21-day moving average of the equity put/call ratio to determine market sentiment. By this measure the ratio also is nearing a level indicative of an oversold market.

From The Blog of HORAN Capital Advisors

Lastly, today's report on individual investor sentiment from the American Association of Individual Investor shows bullish investor sentiment remains at a very low level, 24.32%. Today's sentiment reading remains more than one standard deviation below the average bullish sentiment level of 39%.

From The Blog of HORAN Capital Advisors

With all this negative sentiment as an undercurrent in the current market action this year, odds seem to favor, at worse, a continued sideways market trend and just possibly, a move higher from near these levels as we close out the last third of the year.

Tomorrow's job report is likely to be market moving for some reason; however, a report wildly above expectations is not expected. Wednesday's ADP Employment report indicated payrolls increased by 185,000 which was lower than the lowest estimate of 190,000. Consensus non-farm payrolls are expected to increase 212,000 with the low end of the range equaling 210,000. An increase above 300,000 is really what the this economy needs.


Tuesday, August 04, 2015

The Risk In Chasing Performance

One of the blogs I read on a regular basis is Ben Carlson's A Wealth of Common Sense. Ben's articles are written with a style that employs one of Albert Einstein's quotes, "If you can’t explain it to a six year old, you don’t understand it yourself." His latest article, Avoiding Process Drift, focuses on the vagaries of performance amongst the different investment styles, i.e., large growth, large value, small growth, etc. He notes in the opening paragraph of the article that investors are beginning to question the underperformance or outperformance of the varies investment approaches. Is it time to make a change in one's style allocation? He writes,
"Growth and momentum stocks are on fire this year, crushing their value counterparts, so of course investors are trying to figure out what it all means. The problem with looking at just the latest performance figures is that there’s no context involved. This type of thinking is how investors make mistakes."
Based on the below chart that shows performance as of the end of July, which style does one choose now?

From The Blog of HORAN Capital Advisors

Ben Carlson's article concludes that chasing a recent performance winning strategy has often been a losing strategy. His article contains performance figures noting the underperformance of "performance chasing" strategies.

The important factor for investors is to stick with a process as noted by Ben. Certainly, if ones process is not working over the longer run, i.e., more than just the seven months that have passed this year, adjusting one's approach would be appropriate. Reading Ben's entire article is a worthwhile read.


Sunday, August 02, 2015

Pursuing Low Quality Equities Has Been A Winning Strategy

For most of the market advance since the end of the financial crisis, low quality stocks have been the driver of equity returns. One factor that historically leads to outperformance for high quality stocks is increased market volatility. This higher volatility has certainly been absent for nearly four years and is evidenced by the lack of a 10% market correction since October 2011 and a low VIX level.

From The Blog of HORAN Capital Advisors

From a sector performance perspective, health care continues to lead the other market sectors over the one year and year-to-date time period. The laggards continue to be materials and industrials. These two sectors have been negatively impacted by the continued strength of the U.S. Dollar and weakness in the emerging markets.

From The Blog of HORAN Capital Advisors

From The Blog of HORAN Capital Advisors

The lack of strength in some of the cyclical sectors (materials and industrials) is partially attributable to the slow growth economy in the U.S., the strong dollar and weakness in emerging markets. Last week's GDP report continues to indicate below trend economic growth in the U.S. and a widening gap between actual and trend GDP growth. As the below chart shows, real economic growth since the end of the financial crisis has been half of the growth rate that was generated from 1950 through March 2009.

From The Blog of HORAN Capital Advisors

This slower pace of economic growth seems to have led some investors to gravitate to the more riskier segments of the market in light of overall lower market volatility. This has pushed equity valuations to slightly above average levels and has resulted in less margin of error for some of these growthier firms.


Thursday, July 30, 2015

Steep Drop In Bullish Investor Sentiment

Today's Sentiment Survey report by the American Association of Individual Investors shows bullish individual investor sentiment fell a steep 11.44 percentage points to a low 21.1%. The bull/bear spread is now -19.6%. The last time the bull/bear spread was at this level was the early part of 2013. For investors, this contrarian indicator suggests the market could be setting itself up for a move higher after trading sideways for the better part of this year.

From The Blog of HORAN Capital Advisors
Source: AAII


Monday, July 27, 2015

Equity Risk Premium In A Rising Interest Rate Environment

I have noted in several earlier posts over the years the importance investment professionals place on the equity risk premium (ERP). Although the ERP is one important factor to evaluate, there is quite a bit of disagreement on on how to appropriately calculate the premium. In short though, the ERP is the additional return above the risk free asset an investor requires to invest in stocks. For example, if an investor has a view that the market is under valued and likely to go higher, then one's view is the ERP will decline in the future. Conversely, if the investor has a view that the market is over valued and likely to go lower, then the investor believes the ERP will increase in the future. As the below chart shows, the ERP has declined significantly since late 2011 in conjunction with strong stock returns since the end of the financial crisis

From The Blog of HORAN Capital Advisors

Because the Fed in the U.S. and central banks around the globe have pushed  interest rates down to artificially low levels, this has caused investors' required absolute return on stocks to decline.

On Wednesday, the FOMC meeting announcement will take place around 2:00 p.m. There remains disagreement on when the Fed will raise short term rates, but if short term interest rates rise and cause a commensurate increase on the long end of the interest rate curve, this could place downward pressure on stock prices as the ERP is shifted lower. What can offset this narrowing of the ERP is strength in corporate earnings. However, earnings in Q2 2015 are estimated to decline around 3-4%. On the positive side, earnings comparisons are expected to improve in Q4 2015 and Q1 2016. This improvement in earnings growth is a result of companies lapping the headwinds from energy and the strong U.S. Dollar.

As the below charts show, in the short term, equity prices tend to decline at the onset of a rate hike by the Fed; however, the market tends to adjust and equities move higher over the rising rate cycle. We discussed this in a post early in 2014 titled, Rising Interest Rates Can Be Good For Stocks.

From The Blog of HORAN Capital Advisors

For investors interested in a more in depth review of the ERP, Aswath Damodaran, a professor at Stern School of Business at New York University, publishes a frequently updated paper on the various methods utilized in calculating the ERP.

At this point in time, if investors believe the Fed is very near starting to increase interest rates, stocks that could be impacted the most are the higher valuation equities and momentum stocks. It is these two types of equities that have attracted the most investor attention this year.


Saturday, July 25, 2015

Weakening Sentiment Negatively Impacting Consumer Spending

The IBD/TIPP Economic Optimism Index reported this month continues to indicate weak individual optimism. For July the IBD/TIPP Economic Optimism Index was below the neutral 50% level for the third consecutive month.

From The Blog of HORAN Capital Advisors


In addition to weakness seen in the TIPP Index, IBD notes, "the Six-Month Outlook Index fell for a third straight month, sinking 0.8 point to 44.5. That's the lowest since last September."

From The Blog of HORAN Capital Advisors
Source: IBD

In July, Confidence in Federal Economic Policies did increase three points to 44.2, but remains below the neutral 50% level. The TIPP Index is comprised of three components.
  • The Six-Month Economic Outlook: a measure of how consumers feel about the economy’s prospects in the next six months.
  • The Personal Financial Outlook: a measure of how Americans feel about their own finances in the next six months.
  • Confidence in Federal Economic Policies: a proprietary IBD/TIPP measure of views on how government economic policies are working.
The weakness seen in this sentiment measure has carried over into other sentiment reports. The  University of Michigan Consumer Sentiment Index reading, reported a week ago, fell to 93.3 versus the prior reading of 96.1. Econoday notes, "consumer sentiment has been running very strong most of this year and often well ahead of consumer spending readings which have been flat. But today's report (July 17th) suggests that the best for confidence may already have passed (emphasis added.)

The consumer sector seems to be more discerning in its spending resulting in a decline in the change in personal consumption expenditures and a commensurate increase in the savings rate (purple line in second chart below.)

From The Blog of HORAN Capital Advisors

From The Blog of HORAN Capital Advisors

A result of what seems like a pullback in consumer spending is business and retail inventory to sales ratios continue to increase. Some of this build is a result of an inventory build following the disruptive issues in the first quarter. However, with a slowdown in consumer spending and potential slowing in inventory build in the economy, these two factors will have negative implications for GDP growth in the second quarter.

Lastly, earnings reports for Q2 have, so far, exceeded analyst lowered expectations. Thomson Reuters notes through July 24th, 77% of companies have reported positive EPS surprises; however, only 52% have beat on revenue. The consumer seems to have weakened through the second quarter. With the consumer accounting for about 70% of economic activity, a more positive consumer will be needed to provide economic strength in the second half of the year. Oil prices seem to be taking another leg down with many commodities following suit. These lower energy prices should begin to show up in lower gasoline prices as well and may be necessary to stimulate consumer confidence and consumer spending.


Friday, July 24, 2015

Market Correcting Over Time By Trading Sideways Versus Steep Price Drop

Since February the S&P 500 Index has essentially traded sideways within a 4.8% trading range. This sideways market movement may be resulting in a trading pattern where the market is correcting over time versus correcting with a steep price drop. A sideways market correction enables earnings to catch up to the market's price. As the below chart shows, several of the technical indicators suggest the future market direction is one where the price could trade to the bottom of this trading range highlighted by the yellow box on the chart.

From The Blog of HORAN Capital Advisors

A closer view of the market, as provided by Charles Kirk of the The Kirk Report, shows there are three additional gaps the market may attempt to fill that will take the index level to the lower end of this trading range. His commentary included with his technical analysis notes,
"As shown in the chart [below], the S&P filled the first lower gap, tested and bounced from the 38.2 fibo, and then closed right at first support at the 50 day at S&P 2102. This is seen by many as an important support level that if not defended will soon bring the three other lower gaps into play as trade to targets."
From The Blog of HORAN Capital Advisors

One question is what factors will cause the market to trade to the upside and out of this trading range? One fundamental factor is that of company earnings growth. Recent earnings reports have generally beat analyst expectations, yet S&P 500 earnings growth for Q2 is expected to decline about 2%. Top line revenue results have been weaker than expectations in Q2, with companies citing headwinds from the stronger US Dollar. A positive is the energy and currency headwinds will begin to subside in Q3 and especially in Q4 and Q1 of 2016 as these headwinds are lapped in the year over year comparisons. In Q4 2015 and Q1 2016 earnings growth is expected to be about 4% and 9%, respectively. This better earnings growth could be a catalyst for higher equity prices beginning later in Q3 and into 2016.


Thursday, July 23, 2015

Neutral Sentiment Investors Are More Bearish Than Bullish this Week

An interesting facet of the American Associations of Individual Investors Sentiment Survey has been the recent long streak of an above 40% reading for the neutral sentiment category. This week represents a record 16th straight week with the neutral reading above 40%. Although the neutral reading remains high, this week it did fall from last week's 45.95% to 41.87%. More of these neutral investors have now become more bearish as the bearish sentiment reading increased 2.36 percentage points to 25.60%, whereas the bullish sentiment reading increased a lesser 1.73 percentage points to 32.54%.

As the below chart shows, bullish sentiments remains at a relatively low level, near 1 standard deviation below its long run average. Additionally, the second chart below shows the 8-period moving average of the bullish sentiment reading and it remains near its lowest level since the end of the financial crisis six years ago.

From The Blog of HORAN Capital Advisors

From The Blog of HORAN Capital Advisors
Data source for charts: AAII