Wednesday, April 29, 2015

Stock Buybacks Are Not A Primary Factor In Lower Wage Growth Rates

Recently, a number of articles have been circulating about the need for companies to use more of a firm's cash flow to pay employees a higher wage versus using the cash flow growth to fund stock buybacks. For example,
  • How the Stock Market Destroyed The Middle Class (MarketWatch)
  • Stock Buybacks Are Killing the American Economy (The Atlantic)
  • Profits Are Up, But Wages Are Stagnant. This Senator Has A Plan (ThinkProgress)
The implication in a number of the articles is stock buybacks increase a company's stock price and therefore buybacks are being used to increase the value of senior management stock options. In short though, buybacks have no direct impact on the value of a company's stock price. The below table shows how the share price is unchanged. What can occur is the earnings per share figure can increase due to the lower share count. Other  examples are contained in our post, Proof Buybacks Impact Earnings Per Share. We believe the market is intelligent enough to see through this type of earnings manipulation; thus, not attaching additional value for a firm's stock price due solely to stock buyback activity.

From The Blog of HORAN Capital Advisors


Friday, April 24, 2015

A Further Rise In Crude Oil Prices Facing Headwinds Near Term

Oil rig count has fallen dramatically in the U.S., yet oil supply is continuing to pile up nearly unabated. The market is of the belief that this decline in rig count will ultimately put a halt to the supply growth.

From The Blog of HORAN Capital Advisors

Rex Tillerson, CEO of Exxon Mobil (XOM), recently spoke at the IHS CeraWeek conference in Houston, TX. Tillerson believes oil prices are likely to remain at a lower level for the next several years. Additionally, ConocoPhillips (COP) CEO noted the shale fracking industry has a large number of wells that will be completed once oil prices do rise. This alone is likely to place a cap on the rise in the price of oil.

Lastly, as the below chart clearly shows, in spite of the lower level of oil prices, Saudi Arabia is determined to keep the supply of oil flowing as evidenced by the country's rig count growth (green line.) Their goal is to force fracking companies out of business in an effort to eliminate this swing supply.

From The Blog of HORAN Capital Advisors

With WTI recently rebounding from the mid $40 per bbl price to mid $50's level, further oil price increases could face some headwinds in spite of the decline in global rig count (red line.) In the EIA Petroleum Status Report released on Wednesday, crude oil inventories rose 5.3 million barrels. As noted by Econoday,
"The string of inventory builds continues for oil, up a fat 5.3 million barrels in the April 17 week to 489.0 million which is the 14th straight build and yet another 80-year high [emphasis added]. The build is due to yet another rise in oil imports and also in part to an easing of refinery demand for oil. But refineries are still busy, operating at 91.2 percent of capacity."


Thursday, April 23, 2015

Investor Letter Spring 2015: Another Weak First Quarter?

The first quarter of 2015 once again was a period where reported data suggests a mixed economic picture for the global economy. Interest rates declined slightly leading to positive returns for nearly all U.S. bond market segments. This was once again influenced by lower yields outside the U.S. and the strengthening Dollar. Worries about an economic slowdown have resulted in Europe, Japan and China incorporating additional economic stimulus via interest rate decreases and bond purchase programs. For many investors, the prospect of weak economic news is good for equity markets as central banks pursue stimulus programs to reinvigorate economic growth. Stimulus seems to create a floor for equity markets as liquidity finds its way into the market.

As we noted in our blog post yesterday, Higher Yield and Value Oriented Strategies Underperforming Broader Market, the additional investor demand for these yield oriented equities, i.e. dividend growth stocks, has not resulted in higher returns. Also, Goldman Sachs notes in a recent report that the dividend yield, high quality and strong balance sheet companies have been weaker performers versus other more growth oriented strategies. The below charts provide evidence of this phenomenon.

From The Blog of HORAN Capital Advisors

Looking specifically at economic growth or GDP, the Federal Reserve Bank of Atlanta notes the weakness in GDP in each first quarter since 2010. Some attribute this first quarter weakness to poor weather. However, the Atlanta Fed notes seasonal adjustments since the Great Recession could be negatively influencing first quarter GDP reports as well. As the chart at left shows, weaker economic activity in the first quarters since 2010 is very apparent. The average GDP growth in the first quarter since 2010 has been .6% versus 2.9% for the remaining quarters of the year. The advance estimate for the first quarter of 2015 will be reported on April 29th and the Fed’s tracking of data shows Q1 2015 GDP at just above zero.

For additional insight into our views for the market and economy, one can read our Investor Letter accessible at the below link.

From The Blog of HORAN Capital Advisors


Wednesday, April 22, 2015

Higher Yield and Value Oriented Strategies Underperforming Broader Market

One interesting aspect of the recent equity market advance has been the investor focus on higher quality dividend growth equities. A result of investors' search for yield is many of these higher yielding equities are trading at the higher end of their historical valuation range. Also, given the heightened focus on yield, one would expect the higher quality dividend growth equities to have outperformed the market over the past year. However, as the below chart shows, the SPDR Dividend ETF (SDY) has generated the worst 1 year return versus the other three comparison investments. The second worst performer is the S&P 500 Barra Value Index.

From The Blog of HORAN Capital Advisors

Although investors have pursued higher yielding investments in this low yield environment, the higher demand has not resulted in higher returns. The underperformance of higher quality and higher yielding investments may be a shorter term phenomenon, but investors simply need to be aware that pursuing higher yield/higher quality strategies can result in lagging performance if only in the short run. On the other hand, in a market correction higher quality and higher yield equities tend to outperform the overall market.


Sunday, April 19, 2015

Is This The Beginning Of A Larger Equity Market Correction?

Awaiting the 10% equity market correction seems to be on the minds of a number of strategists as soon as the market begins a turn lower. The last correction of greater than 10% occurred in 2011 when the S&P 500 Index declined nearly 20% between July and October 2011.

Since March 23rd through Friday's close, the S&P 500 Index has declined 43 points to 2,072 or a decline of just 2%. In the first week of March, the S&P fell 3.5% before rebounding. An important support level has been the 50 day moving average; however, when this level is violated, the 150 day moving average has served as strong support for the market. As can be seen in the below chart, the S&P 500 Index closed below the 50 day moving average on Friday. What appears important about the technical set up at this point is the stochastic indicator is just now showing an overbought level for the market. In prior 50 day moving average violations, the stochastic indicator did not show as oversold until the market found support at the 150 day moving average.

From The Blog of HORAN Capital Advisors


Economic Surprise Indices: Bad News Might Actually Be Good News

One criteria investors and strategists evaluate on a regular basis is whether or not economic data that is reported on a near daily basis is exceeding or missing expectations. A commonly reviewed index is the Citigroup Economic Surprise Indices (CESI). According to Bloomberg,
"The Citigroup Economic Surprise Indices are objective and quantitative measures of economic news. They are defined as weighted historical standard deviations of data surprises (actual releases vs Bloomberg survey median). A positive reading of the Economic Surprise Index suggests that economic releases have on balance [been] beating consensus. The indices are calculated daily in a rolling three-month window. The weights of economic indicators are derived from relative high-frequency spot FX impacts of 1 standard deviation data surprises. The indices also employ a time decay function to replicate the limited memory of markets."

One takeaway from the negative level of the CESI for the U.S. is the fact economic reports have been falling short of strategist expectations. This in turn could push the Fed to act later on pushing short term interest rates higher. Also, as noted in a recent article in the Wall Street Journal, When Bad News Is Good for Stocks,
"It is important to understand, though, that the surprise index doesn’t rise or fall with the ebb and flow of the economic cycle. Because it measures a rolling average of how things turn out relative to forecasts, more often than not it tends to turn negative after there has been a streak of encouraging economic news, such as in late 2014. This is because forecasters often mistakenly extrapolate recent trends."
"When the index is deeply negative, as it is today, that is usually a good sign for stocks. Following the weakest 5% of observations since 2003, the S&P 500 rose by 14.4%, on average, during the following six months. Conversely, it rose by just 5.5% following times when the surprise index was highest."

"Today’s trough puts the index in the lowest 8% of readings. This is unusual given stocks are within spitting distance of all-time highs, despite softer-than-expected economic reports."

"The possible reason for this revolves around the Federal Reserve, which may be just months away from raising interest rates for the first time in nine years. News that is disappointing enough to sow doubt in rate setters’ minds without signaling a recession is seen as ideal for stock prices."

From The Blog of HORAN Capital Advisors

Further, the CESI for the Euro Zone has been counter to that of the U.S., that is, economic data reports have been exceeding strategists' expectations and the Euro STOXX 600 Index has responded positively. We have commented frequently with clients about the recent need to hedge the exposure to the the Euro versus the US. Dollar in order to protect returns generated in the Euro currency.

From The Blog of HORAN Capital Advisors

For investors, is this string of expectation beating reports in Europe nearing an end? We do not believe so. We are seeing corporate earnings report revisions trending more to the positive than the negative as well as continued expectation beating economic reports out of Europe. We touch on several of these points in our soon to be released Investor Letter. In a recent Bloomberg article,
"Jack Ablin, chief investment officer of BMO Private Bank in Chicago, said he pays attention to the surprise indexes as a way to gauge when a particular national economy may be turning and looks for good value in equities.
From The Blog of HORAN Capital Advisors
It is an early indication of a momentum shift," he said, "adding that he's been raising the amount of money put into international stocks. While Ablin expects moderate U.S. growth, he said a strong U.S. dollar has the potential to dampen the expansion."

Interestingly, the Economic Surprise Indices readings could be suggestive of a market environment that is broadly favorable for a number of global equity markets. The desire by the U.S. Fed to get rates off the near zero level and data that pushes this further into the future and conversely, a number of central banks outside the U.S. pursuing quantitative easing measures, both can be positive for global equity markets.


Sunday, April 12, 2015

Expecting A Weak Q1 2015 Earnings Season, But Looking At Forward Guidance

With first quarter 2015 earnings season beginning to hit full stride in the coming two weeks, earnings growth expectations for Q1 2015 are now negative at -4.6%. The last negative quarterly growth result was Q3 2012 as can be seen in the below table from Factset.

From The Blog of HORAN Capital Advisors
Source: Factset

Out of the small percentage of S&P 500 companies that have reported to date, 70% have cited the strong Dollar as the cause of their negative Q1 2015 report. As noted at the beginning of the article, the last negative earnings growth quarter occurred in Q3 2012. Importantly, these earnings reports are reflective of past results and investors will want to pay attention to forward guidance. Subsequent to the Q3 2012 negative growth quarter, the S&P 500 Index went on to generate outsized gains of 30% in 2013 as can be seen in the below table.

From The Blog of HORAN Capital Advisors

To provide some insight on the US Dollar strength and noted in the Factset report,
  • "During the course of the first quarter, the dollar strengthened relative to the euro. On December 31, one euro was equal to $1.21 dollars. On March 31, one euro was worth about $1.07 dollars."
  • "The dollar has also strengthened relative to year-ago values for both the euro and the yen. In the year ago quarter (Q1 2014), one euro was equal to $1.37 dollars on average. For Q1 2015, one euro was equal to $1.13 dollars on average. In the year-ago quarter (Q1 2014), one dollar was equal to $102.76 yen on average. For Q1 2015, one dollar has been equal to $119.17 yen on average."
Lastly, it should be noted the earnings and revenue expectations from the energy sector are a significant contributor to the Indexes overall decline in earnings and revenue growth. We believe, though, the lower energy prices are a net plus to the economy via the benefit the consumer receives from lower energy prices.

The first quarter reports almost seem like a replay from the first quarter of 2014 when weather across the country was a significant drag on economic growth. In Q1 2015 we had weather effects as well. On top of the weather, the West Coast Port shutdown also negatively impacted the retail segment. For investors, hearing forward guidance comments from the conference calls this quarter will be important in ascertaining future earnings expectations.


Friday, April 10, 2015

Emerging Markets Not Out Of The Woods Yet

As investors seem to be expecting an increase in interest rates by the Fed to be pushed out later this year, the emerging market trade has seen a positive impact relative to its U.S. developed counterpart. As the below chart shows, on a year to date basis the iShares MSCI Emerging Markets ETF (EEM) has moved up 9% versus the S&P 500 Index return of 2%.

From The Blog of HORAN Capital Advisors

This risk on appetite has carried over into small cap stocks as well. Year to date the Russell 2000 Index is up 5% versus the previously noted 2% for the S&P 500 Index.

From The Blog of HORAN Capital Advisors


These are a couple of divergences we mentioned in a post at the beginning of 2015 that the market would need to address, A Market Needing To Resolve Divergences In 2015.

Lastly, on a longer term basis, Dollar strength has historically been a headwind for emerging market investors. Maybe the rate increase cycle begins later this year; however, when it does, downward pressure could face emerging market investments as the rate increase nears.

From The Blog of HORAN Capital Advisors


Thursday, April 09, 2015

A Good Quarter To Be a Non-Dividend Paying Stock

Through the first quarter of 2015, performance would suggust it was a good time to be a non dividend payer stock. As the below table shows, the average return of the non-payers generated a return of 6.49% versus the payers average return of 1.16%. I would note, however, the average return in the quarter for both the payers and non-payers exceeded the cap weighted return of the overall S&P 500 Index.

From The Blog of HORAN Capital Advisors


Thursday, March 26, 2015

Strong Buyback Activity Reducing Share Count

S&P Dow Jones Indices is reporting that stock buybacks fell sequentially in the fourth quarter last year to $132.6 billion from the third quarter level of  $145.2 billion. However, on a year over year basis, buybacks increased by 2.5%. this still strong buyback activity has served as a tailwind for earnings growth as the report notes 20% of the S&P 500 companies have reduced their share count. Howard Silverblatt, Senior Index Analyst at S&P Dow Jones Indices notes, "...While fourth quarter expenditures were down 8.7%, the number of issues reducing their share count by at least 4% year-over-year, and therefore increasing their EPS by at least that amount, continues to be in the 20% area – a significant level." Other key metrics noted in the report:
  • "More issues reduced their share count this quarter than last, with 308 doing so in Q4, up from 257 in Q3 and 276 in Q4 2013."
  • "Significant changes (generally considered 1% or greater for the quarter) continued to strongly favor reductions, and also increased, as 117 issues reduced their share count by at least 1%, compared to last quarter’s 101 and the 112 which did so in Q4 2013."
  • "Share reduction change impacts of at least 4% (Q4 2014 over Q4 2013), which can be seen in EPS comparisons, were flat at 99 in Q4 2014 from Q3, but up from the 83 posted in Q4 2013."
Although the earnings growth trend appears to be slowing, cash generation continues to be strong for companies. Silverblatt notes with banks now appearing to focus on dividends and buybacks, 2015 could witness another strong year for dividends and buybacks for the S&P 500 Index.

From The Blog of HORAN Capital Advisors

From The Blog of HORAN Capital Advisors

Data Source: S&P Dow Jones Indices


Thursday, March 19, 2015

Bullish Sentiment Declines To Level Last Seen In Early 2013

This morning the American Association of Individual Investors reported individual investor bullish sentiment declined to 27.2% versus last week's reading of 31.6%. This is the lowest level for bullish investor sentiment since April 4, 2013. Additionally, today's report places the sentiment reading at one standard deviation below the average sentiment level. The decline in sentiment over the past week is proving its status as a contrarian indicator as the S&P 500 Index is higher by 2.9%.

From The Blog of HORAN Capital Advisors
Source: AAII


Saturday, March 14, 2015

Bearish Equity Sentiment Showing Up In The Equity Put/Call Ratio

As we noted Thursday, the American Association of Individual Investors reported a further decline in its bullish sentiment reading. The reported level of 31.6% is near a level indicative of overly bearish investor sentiment. Further confirmation of this bearish sentiment is seen in Friday's equity put/call ratio which is reported at .80. As with the AAII bullish sentiment reading,  the equity put/call ratio is most predictive at extreme levels or above 1.0. Nonetheless, overly bearish investor sentiment is suggestive of a near term equity market bounce.

From The Blog of HORAN Capital Advisors


Thursday, March 12, 2015

Investors Less Bullish As Market Nears Oversold Level

The American Association of Individual Investors reported an 8.2 percentage point decline in bullish investor sentiment to 31.6% this morning. This is the lowest bullishness level since bullish sentiment was reported at 30.89% in early August of 2014.

From The Blog of HORAN Capital Advisors
Source: AAII

This decline in bullish sentiment has occurred at a time when the S&P 500 Index appears to be nearing an oversold level. As the below chart shows, the technical stochastic indicator has fallen to an oversold level. The money flow indicator and MACD indicator have yet to confirm an oversold level; however, the market does appear to be nearing a potential bounce level. In the recent past the 150 day moving average has served as a support level for the S&P 500 Index and it will be important that this level (2017) is held in this recent pullback.

From The Blog of HORAN Capital Advisors


Sunday, March 08, 2015

Additional P/E Multiple Expansion Possible Until The First Fed Rate Hike

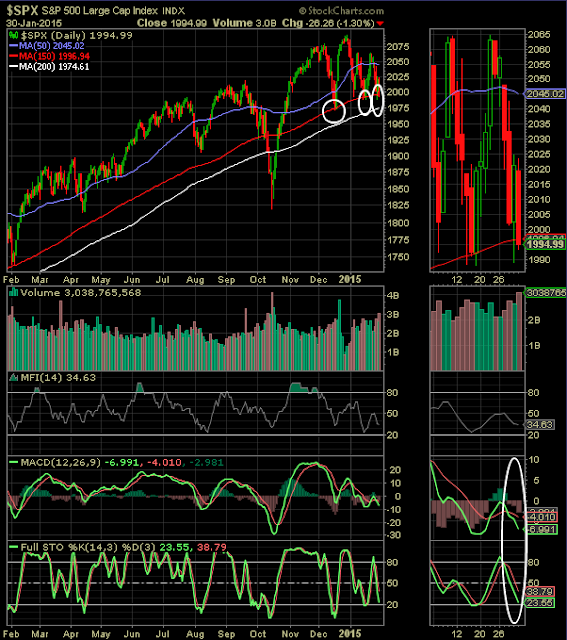
A common occurrence in equity bull market cycles is the fact that a company's valuation, or P/E multiple, expands. This so called multiple expansion is one factor that contributes to overall equity returns during bull market phases. The downside to multiple expansion is it does not occur ad infinitum. As the below chart shows, the P/E multiple for the S&P 500 Index has expanded by 64% by increasing to 17.3x earnings versus 10.6x earnings at the start of the current bull market.

From The Blog of HORAN Capital Advisors

One factor that will cause multiple expansion to come to an end, and ultimately revert to contraction, is an increase in interest rates. The reason for this is investors will value future earnings less when a higher discount rate is used to value those earnings in equity valuation models.

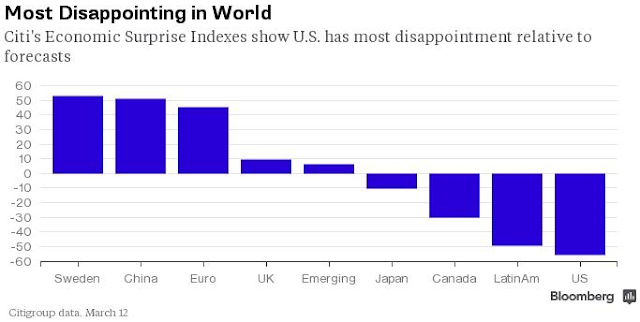
The market took Friday's job report as another sign the Fed is nearing a time where it will increase short term interest rates. The job report showed 295,000 jobs were generated in February. The report also noted the unemployment rate declined to 5.5%, which is the lowest level since May 2008. One data point that continues to generate differing points of view is the labor force participation rate. This part of the report noted the participation rate fell slightly to 62.8% from 62.9%. Many market strategists are viewing the jobs report as another sign the Fed is nearing an end to easy monetary policy and a rate hike in June or at the latest by the end of summer.

So with a rate hike nearing, will market forces result in a P/E multiple that begins to contract? Historical data shows; however, market multiples have broadly expanded up until the time of the first rate increase. A report by Sam Stovall, U.S. Equity Strategist for S&P Capital IQ, notes, "After examining the 16 times since 1946 that the Federal Reserve started a rate tightening program, the median multiple on trailing 12-month GAAP (or “As Reported”) EPS rose from 17.7X six months before to 17.9X three months before and 18.5X on the date of the first rate increase. Only in the three and six months after the Fed started raising rates did the P/E median decline to 18.1X and 16.7X, respectively." In a recent report from Goldman Sachs, they include a table comparing S&P 500 returns along with the impact on valuations before and after Fed rate increases. As can be seen in the below table, P/E multiples and returns are positive up to the first rate increase.

From The Blog of HORAN Capital Advisors

Also, given the near zero level of interest rates along with the low level of inflation, equity valuations are not as stretch as they may appear in nominal terms.

From The Blog of HORAN Capital Advisors

The Fed does appear to be in a position where an interest rate increase is likely to occur this year. One could surmise the Fed is in a position where they need to get rates back to a more normalized level. At this near zero interest rate level, the Fed has fewer monetary options to implement in the event an economic shock where to occur. Additionally, because rates are at artificially low levels, history has shown there is a positive correlation between stock prices and interest rates when rates rise from levels below 5%.

From The Blog of HORAN Capital Advisors

A part of the reason for this is when rates are at such extreme lows, initial rate increases are instituted simply to get rates back to a more normal level. When rate increases occur at levels higher than 5%, this can be a sign of an overheating economy with the Fed's intention to slow down the economy. As the economy slows, corporate earnings are likely to slow, resulting in equity prices declining as well.

For investors then, as a rate hike does seem near,  positive equity market returns can be achieved up until the time the first rate increase occurs. Also, a portion of the returns can be generated from a continued expansion of P/E multiples.


Friday, February 27, 2015

Market Advance Not Extraordinary In Terms Of Magnitude And Duration

In prior post over the past year I have highlighted the current market advance as it relates to prior bull markets. This information has been prepared by Chart of the Day and the below chart and commentary updates the comparison for the Dow Jones Industrial Average. The most recent commentary for the S&P 500 Index is included in the post, Current Stock Rally Below Average In Magnitude.
"The Dow just made another all-time record high. To provide some further perspective to the current Dow rally, all major market rallies of the last 115 years are plotted on today's chart. Each dot represents a major stock market rally as measured by the Dow with the majority of rallies referred to by a label which states the year in which the rally began. For today's chart, a rally is being defined as an advance that follows a 30% decline (i.e. a major bear market). As today's chart illustrates, the Dow has begun a major rally 13 times over the past 115 years which equates to an average of one rally every 8.8 years. It is also interesting to note that the duration and magnitude of each rally correlated fairly well with the linear regression line (gray upward sloping line). As it stands right now, the current Dow rally that began in March 2009 (blue dot labeled you are here) would be classified as below average in both duration and magnitude."
From The Blog of HORAN Capital Advisors


Tuesday, February 10, 2015

A Rising Bearish Wedge Pattern Is Developing In the S&P 500 Index

Near the end of October last year the S&P 500 Index moved into a sideways trading range that has seen the market move back and forth between 1,975 and 2,093. Then on December 19, a spike in up volume occurred that created the top of this trading range. Subsequent to this capitulation buying the market has struggled to recapture this December high mark with the market trading action forming a rising bearish wedge pattern. A rising wedge pattern tends to resolve itself with a market that breaks to the down side. Several highlights from the below chart.
  • The rising wedge is noted by the solid green and solid red lines. Also, the market is making lower highs as evidenced by the red dashed line.
  • The full stochastic indicator turned negative today with the fast green line dipping below the slower moving red line. This negative divergence has occurred at a level where the stochastic indicator shows the market is short term overbought.
  • Lastly, the on balance volume indicator (OBV) has trended lower since the start of the year. With the OBV, it is the trend of the line that is important. As noted on the stockcharts.com website, "OBV rises when volume on up days outpaces volume on down days. OBV falls when volume on down days is stronger. A rising OBV reflects positive volume pressure that can lead to higher prices. Conversely, falling OBV reflects negative volume pressure that can foreshadow lower prices." The OBV often moves before a stocks price.

From The Blog of HORAN Capital Advisors

To provide another market perspective, Charles Kirk of The Kirk Report always provides insightful technical analysis during the week (small subscription required). In his strategy report tonight, he provides the below chart of the S&P 500 Index graphed in a 30 minute time frame and included the following analysis,
"By closing above swing resistance at S&P 2064 today, a new smaller bullish range breakout setup with a target at S&P 2141 has now triggered. Today’s rally also further developed the handle on the new cup setup we talked about in yesterday’s report and which you can also see in the 30 minute view below but needs to trade above last Friday’s intraday high at S&P 2072 to fire."
From The Blog of HORAN Capital Advisors

"With the attempted small range breakout in motion, it is now important that we see sustained bullish upside follow through to confirm. The first step would be to clear and hold above last Friday’s high at S&P 2072 and then take out the prior early December swing high at S&P 2079. If those levels are broken all that would remain is the December high at S&P 2093. If we are to now move away from this multi-month trading range, we will need to see sustained bullish upside follow through. In sum, this is the bulls’ best chance yet to try to put this trading range behind it. Whether it can hold above the smaller range is key."
In conclusion, I think Charles Kirk's analysis and mine are telling a similar technical story. The key is the fact the market needs to break resistance at the S&P 500 December high of 2,093. However, I believe the on balance volume indicator and the stochastic indicator are suggesting the market may trade lower before pushing through this December high level.


Saturday, February 07, 2015

A Strong Dollar Does Not Mean Large Cap U.S. Multinationals Underperfom Small Cap Equities

The US Dollar has been on a strengthening trajectory since early 2011 and more so since mid year last year. This move in the Dollar has been a headwind for U.S. domiciled multinational companies earnings, with many firms citing this as a reason for earnings disappointment during this earnings reporting season.

From The Blog of HORAN Capital Advisors

One belief is investors can avoid this negative currency impact within their investment portfolio by focusing more on small company stocks since small caps are less exposed to this exchange rate risk. The thinking is small cap companies generate a larger percentage of their overall business from domestic sources versus the larger multinationals that generate a larger portion of their revenue from overseas. In fact this seems to be the case during the earlier phase of the Dollar's strengthening as the above chart shows small cap outperformance from 2010 through most of 2013. However, as the Dollar continues to strengthen, larger cap companies actually outperform small caps as occurred in the mid 1990s. This can be seen in the below chart that compares the relative return of large caps versus small caps (orange line) to the U.S. Dollar Index.

From The Blog of HORAN Capital Advisors

S&P Capital IQ provided additional analysis in a report released in late January titled, Don't Duck A Rising Buck. In the report S&P analyzed the performance of large cap stocks versus small cap stocks during bear markets and bull markets and compared the results to the trend of the U.S. Dollar. The report is a worthwhile read for investors. In short, the data suggests large cap companies actually outperform small cap companies in a rising Dollar environment when the overall equity market is in a bull market phase. This outperformance occurs when the Dollar Index rises above 95 (closed Friday just below 95.) The report contains a sector performance comparison as well.

From The Blog of HORAN Capital Advisors

There are several reasons this outperformance by large caps may occur when the Dollar Index is above 95 and when the equity market is in a bull phase. Foreign investors likely see the U.S. economy growing at a faster pace than other economies, and this is the case today. With this thinking, foreign investors will allocate investment funds to U.S. equities. In doing so, they tend to focus on larger multinational firms that are more broadly know. Additionally, larger equities are more likely to be more liquid. This additional investment flow into the U.S. and the investment in Dollar denominated assets further pushes the U.S. Dollar Index higher. For non U.S. investors then, they receive an additional return benefit from a positive currency exchange when Dollar's are converted back into their home currency.

Just one comment on small caps. At HORAN, we have been out of small cap equities since late 2013. A reason we chose to eliminate the category from our client allocations was partially due to the valuation of small cap stocks broadly. In a Reuters report today, Valuations May Hurt Small Caps, Despite Job Growth, the article cites the apparent overvaluation of small cap stocks. Specifically, the article notes,
"The trailing price-to-earnings ratio of the index is at 22.7, which is 40 percent more than its long-term average of 16.2. Its price-to-sales ratio of 1.6 is nearly 67 percent higher than its long-term average."
In summary, even though small caps are less exposed to overseas business, there are several factors that indicate large cap U.S. equities outperform in spite of the currency headwind. Additionally, the valuation of small cap stocks are likely to be a headwind for the small cap equity asset class.


Sunday, February 01, 2015

The S&P 500 Index Nearing A Technical Bounce Level?

The month of January was not kind to U.S. equity investors. The S&P 500 Index ended the month down 3.00% and the Dow Jones Industrial Average was down 3.58%. The small cap and mid cap indices did not fare much better. On the surface, European equities appeared to be a bright spot with the S&P Europe 350 Index up 7.27%. However, for a U.S. investor not hedging the Euro/Dollar currency exchange, virtually all of this gain was lost in the currency translation back to the Dollar. The S&P Europe 350 Index was up a marginal at .09% in US Dollars.

From a sector perspective, the defensive sectors were the bright spot as can be seen in the below graphic. For the month utilities were up 2.37% and Health Care was up 1.23%, A bit surprising was the weakness seen in the consumer discretionary sector which was down 3.06%. Consumers seem to be restraining their spending even though they are realizing a large savings at the gas pump.

From The Blog of HORAN Capital Advisors

From a technical perspective, the market is not at an extreme oversold level but has approached an important support level, the 150 day moving average. On Friday, the S&P 500 Index closed at 1994.99 which is just below the 150 day M.A of 1996.94 as can be seen in the below chart. The 50 day M.A. has served as important support for the market over the past three years.

From The Blog of HORAN Capital Advisors

Other technical indicators, such as the MACD and stochastic, are nearing levels indicative of a market that is nearing a potential bounce. In my mind though, these technical indicators could see a little more weakness before the market does move higher. The percentage of stocks trading above their 50 and 150 moving average also are not at extreme levels, but are at levels where market recoveries occurred in the rally during the last several years.

From The Blog of HORAN Capital Advisors

Of a bit of concern is individual investor sentiment seems to be shaking off this resent pullback. For example, the American Association of Individual Investors reported bullish investor sentiment increased seven percentage points to 44.17% last week, which is above the long term average of 39%. Additionally, the bull/bear spread widened to 21.78% from 6.35% in the prior week. The long term bull/bear ratio average is 8.6%.

From The Blog of HORAN Capital Advisors

Lastly, the CBOE equity put/call Ratio declined as of Friday to .68, which means a slight increase in investor bullishness. This, along with the AAII sentiment indicator, is a contrarian one and both would suggest a little market weakness before a bounce ensues. As noted before on our blog, these sentiment indicators are most predictive when at extreme levels though.

From The Blog of HORAN Capital Advisors

Consumers are a critical component to economic activity and what they say has not yet translated into what they are actually doing. However, positive consumer sentiment is likely to lead to an improving consumer sector as we move out of winter and into the summer. As Econoday noted last week, Friday's University of Michigan consumer sentiment report was another strong and positive one.
"Consumer sentiment held on to its very strong surge at the beginning of the month, ending January at 98.1 vs the mid-month reading of 98.2 and compared against 93.6 in December. The current conditions component extended its first half gain to 109.3 vs 108.3 at mid-month and against 104.8 in December. The comparison with December points to strength for January consumer activity. The expectations component ends January at 91.0 vs 91.6 at mid-month and 86.4 in December. Price expectations are low, at 2.5 percent for 1-year expectations, up 1 tenth from mid-month but down 3 tenths from December, while 5-year expectations remain at 2.8 percent, unchanged from both mid-month and December. Consumer spirits are now very strong but have yet to translate to a similar pickup in consumer spending."
From The Blog of HORAN Capital Advisors
Source: Econoday

For investors then, the market's action around the 150 day moving average in the days ahead will be important. The near oversold levels reached by the MACD and the stochastic indicators, just naming a few, are indicative of a market that is nearing a position where an oversold bounce could occur. Certainly of concern is the fact the S&P 500 Index has been making lower highs and lower lows so far this year.


Thursday, January 29, 2015

How To Profit From An Increase In Oil Prices When It Occurs

One investment vehicle that may seem appropriate for participating in an eventual rise in crude oil prices is to invest in an ETF that directly tracks crude oil itself. One such ETF is the United States Oil ETF, ticker USO. There are many others that can be found here. However, investors should be aware that many of these ETFs gain crude oil exposure using futures contracts. Consequently, the ETFs using futures will not track oil prices directly. Several key points investors should be aware of regarding ETFs and mutual funds that use futures contracts for investment exposure follows:
  • USO gains exposure to oil using futures contracts. The issue with utilizing futures contracts has to do with the shape of the futures curve for oil. In order for USO to maintain exposure to oil, the index manager must “roll forward” futures contracts for oil. If the futures curve predicts higher prices for oil in the future, this added cost to roll forward the oil contracts eats into USO’s return. As the below chart shows the WTI futures curve is in what is called contango. This means the curve is upward sloping, i.e., higher future oil prices expected by the market. As a result the USO investment loses money as contracts are rolled forward. This is known as negative roll yield. A recent article on the oil futures curve, Contango Widens, can be read on Bloomberg.
From The Blog of HORAN Capital Advisors
Source: eia

As noted in a recent Morningstar analysis for USO,
  • "in 2014 USO declined by 43%, close to WTI's spot price collapse of 46% for the year. However, in 2009 (the last time there was a sharp rebound in oil prices) USO gained 14%, while the spot price soared 78% higher [emphasis added]." The lagging performance of USO versus the price of oil is largely due due to the negative roll yield issue mentioned above.
So how can an investor benefit from an increase in crude oil prices? Below is a chart of USO, the ETF with ticker XLE and the price of West Texas Intermediate crude. As can be seen on the chart, the energy sector ETF, XLE (orange line), actually outperforms USO (red line) as energy prices began to rise in 2010 as noted by the circle on the chart.

From The Blog of HORAN Capital Advisors

In summary, if one believes oil prices will rise, investing in an ETF like XLE is likely a better way to profit from rising oil prices.


Saturday, January 24, 2015

Investor Letter Winter 2014: Expectations In The Coming Year

We recently published our final Investor Letter for 2014. In the letter we take a look at the market and economy in 2014 and our outlook for 2015. As we comment in the newsletter, investors will be faced with a number of issues in 2015, oil price volatility, currency issues, stimulus programs around the world, just to name a few factors. January has already started with market volatility that me be unsettling to investors. For further insight into our views for 2015, our Investor Letter can be accessed at the below link.