Showing posts with label Commodities. Show all posts

Sunday, March 14, 2021

Oil Inventory Level Remains High Potentially Limiting Steeper Rise In Energy Prices

A number of factors will influence the price of oil over time, but the supply level and active rig count provide useful insight. Other variables come into play as well, like Middle East conflicts and the level of the U.S. Dollar. The price of West Texas Crude has increased from around $15 per barrel in April of 2020 to its current $66 per barrel. On the surface it seems oil inventory levels are at a sufficiently high level, as the green line in the below chart indicates, that oil prices should not continue to trend higher at a pace similar to the pace over the last year. With the rig count beginning to turn higher, additional oil supply will eventually find its way onto the market; however, there is a lag in oil production growth vis-à-vis rig count growth.


Sunday, December 08, 2019

Gold Losing Its Luster

There can be a number of reason for an investor wanting to have an allocation to Gold. One reason for owning Gold is it tends to serve as a safe haven asset and perform well in an environment where economic activity is slowing. On the other hand investors might look to Copper as an investment if they expect a pickup in economic activity as it tends to rise with a growing economy. 


Sunday, November 11, 2018

Dollar Defies The 7-Year Cycle

Historically the U.S. Dollar has had a tendency to exhibit strength over a 7-year cycle. In July of this year the Dollar strength cycle crossed into its eighth year though, as seen in the below chart.


Tuesday, July 03, 2018

Oil Supply Continues To Trend Lower

Thursday this week markets will get another look at oil inventory levels with the release of the weekly EIA Petroleum Status Report. The past few weeks have confirmed strong declines in oil inventory levels. Last week's draw-down was 9.9 million barrels and the prior week saw a contraction of 5.9 million barrels.


Wednesday, April 11, 2018

US Dollar Influencing Oil Prices

Nearly two years ago four factors were influencing the energy market and specifically the price of oil. 
  • Oil inventory in the U.S. hit a record high
  • The price of crude (West Texas Intermediate or WTI) reached a post financial crisis low
  • Rotary oil rig count hit a record low of 404
  • The trade weighted value US Dollar hit a post financial crisis high
The fact oil inventory spiked is partially attributable to technological advancement in drilling and specifically, increased supply from fracking activity. The subsequent low level of drilling activity that began a few years ago contributed to the supply decline. Today, the rig count has once again moved higher and the oil market may be seeing a potential bottoming of the supply decline, yet oil prices continue to move higher as seen in second chart below.


Saturday, January 13, 2018

A Balancing Oil Market, But Will It Last?

In May 2011 crude oil (WTI) hit $113 per barrel and remained elevated at or near that level until the summer of 2014. Given the high price of crude and the expansion of fracking at that time, crude supply continued to grow until peaking in mid 2017. I wrote about the high crude supply level in mid 2017 and its impact on keeping oil prices down, Higher Oil Prices Contend With Too Much Supply And Higher Energy Efficiency. Today, we are seeing crude oil inventory decline at a fairly rapid rate as can be seen with the green line in the below chart.


Saturday, July 22, 2017

Strong Earnings Growth And Favorable Valuations Lead To Weak Stock Returns

One factor utilized in uncovering potential investment opportunities is to evaluate companies and sectors that are projected to generate strong earnings and cash flow growth over the course of the next year or more. The risk associated with simply reviewing earnings growth rates is the fact other variables often influence the future price performance of a company's stock. A good case in point at the moment can be found in evaluating energy companies and the associated sector. For calendar year 2017 and 2018, the energy sector is expected to exhibit the highest earnings growth rate among all the S&P 500 sectors. For 2017 the year over year earnings growth rate for the energy sector is estimated to equal over 300%. In 2018 the YOY growth rate is projected to equal 41.3%.


Even reviewing the sector PEG ratios (P/E to earnings growth rate), the energy sector looks very attractive and is the only sector that has a PEG below 1.0.


Friday, May 05, 2017

Higher Oil Prices Contend With Too Much Supply And Higher Energy Efficiency

Almost to the day one month ago, when oil was trading at $52.25/bbl, I noted higher oil prices faced strong headwinds. I mentioned several factors that would likely result in lower oil prices, with the largest being the oversupply of oil in an environment where drilling activity was picking up. Fast forward to today and the price of spot WTI has fallen 12.8% to $45.55/bbl. Additionally, supply does not seem to want to abate as the rig count has increased to 870 rigs this week versus 839 in the month ago article.


A faster pace of supply growth continues to be the overriding issue although demand continues to increase as well, but yet to reach pre-recession levels. Certainly, the below trend rate of economic growth is playing some role in the lower overall demand for petroleum products.


Another factor in the slowing rate of demand growth is energy efficiency improvements made to a number of petroleum consuming parts of the economy. One significant area of improvement is in the area of vehicle gas mileage. This is important as gasoline is the main petroleum product consumed in the U.S. and accounts for nearly 47% of petroleum consumption.

As the first chart below shows, since 2014, consumers have consistently driven more miles, year over year. This has translated into continued growth in total vehicle miles driven on a rolling 12-month basis and finally surpassing the pre-recession peak in 2015.


The efficiency is most evident in the below chart the shows miles per gallon for all vehicles (red line) along with gallons consumed per vehicle in a given year (blue line.) Improvement in both of these areas has slowed the growth in the demand for petroleum products.


In conclusion, a below trend pace of economic growth and efficiency improvements have served as a headwind to higher oil prices, especially in an environment were drilling activity is increasing. The article from a month ago also discussed the potential oil price headwind resulting from a stronger U.S. Dollar, vis-à-vis, a potentially higher interest rates. This may become a more significant factor next month as the odds of a Fed interest rate hike in June are now around 75%. 


Saturday, April 08, 2017

Higher Oil Prices Face Strong Headwinds

Since March 27 spot WTI crude oil has moved higher by 11% increasing from $47.02/bbl to $52.25/bbl. This rise in price has occurred during a period when crude inventory levels in the U.S. continue to rise. This increase in crude inventory levels is taking place at a time when the drilling rig count continues to increase as well. Historically, an increase in rig count has coincided with higher crude prices; however, inventory levels were much lower in the past when the rig count began to rise.


Sunday, August 28, 2016

Higher Oil Prices Must Contend With Too Much Inventory

Crude oil prices spiked above $50/bbl in early June and have fallen back to $47/bbl as of Friday's close. The high $47 level remains above the early August low of $39.52. Further weakness in oil prices is likely as a result of stubbornly high crude oil inventories (excl. the Strategic Petroleum Reserve.) On Wednesday last week, the Energy Information Administration (EIA) reported weekly inventories increased 2.5 million barrels and is a reversal of the 2.5 million barrel decline in the prior weekly report. Not that one or two weekly reports tell the entire story, but, as the below chart shows, inventories remain at very elevated levels and prices are not likely to move higher until this elevated inventory is reduced.


Tuesday, August 02, 2016

Oil And Equity Price Trend Conundrum

A part of the anticipated improvement in forward earnings for the S&P 500 Index is an improvement in the energy sector. The health in the energy sector has spillover into other sectors of the market like the industrial sector that sells into the energy space. Of late, however, oil prices have pulled back significantly from over $50/bbl in June and dropping below $40/bbl yesterday. This decline in price can be directly attributable to the elevated supply of crude.


Sunday, May 08, 2016

Continued Growth In Oil Supply Likely Leads To Lower Crude Oil Price

WTI Crude has rebounded over 70% to $44.60/bbl from its $26/bbl low reached on February 11th. This price recovery has occurred while supply continues to grow at an unabated pace as can be seen in the below chart.


The U.S. Energy Information Administration's summer 2016 fuels outlook (PDF) is forecasting continued supply growth with the expectation oil prices will average $35/bbl this summer. Driving this supply growth is continued elevated production from OPEC Countries that is in excess of supply cuts in many of the other oil producing countries.


Wednesday, April 13, 2016

Oil & Plenty

I once raced a Thistle sailboat we named Good & Plenty, after the pink and white licorice candy treat. I digress but that Thistle was one fast boat when the winds were good. With all the focus on oil, and after the morning release of the EIA Petroleum Status report today, it is evident the world is awash in Oil & Plenty of it. The current price of WTI Crude has recovered to a level last seen in November of 2015. The rebound in the price of WTI to the $42 per bbl area has had a positive impact on the stock prices of many of the energy related companies. As the below chart shows, the energy sector within the S&P 500 Index has had the largest positive move off of the February 11, 2016 market low, i.e., up 19.6%.


Monday, March 07, 2016

Oil Price Rise Predicated On Potential OPEC/Russia Output Cuts

Oil prices in the first quarter of this year have turned higher, much like the pattern at the beginning of 2015. Since mid February the price of Brent Crude has increased nearly 40%, climbing from the high $20/bbl level to the high $30/bbl level.


Friday's Commitment of Traders Report (COTR) released by the Commodity Futures Trading Commission (CFTC) noted money managers increased bullish bets on oil to the highest level since November. This increased bet on higher oil prices has occurred in spite of a higher than expected increase in oil inventory. The EIA Petroleum Status Report saw crude inventories rise 10.4 million barrels to a record 518 million barrels of oil inventory. The EIA report noted gasoline inventory declined 1.5 million barrels as demand for gasoline increased a strong 6.9% on a year over year basis. The oil inventory in the below chart includes not only crude oil, but gasoline, distillate fuel oil and all other oil related inventory.


As Reuters reported after the market close on Friday,
"U.S. oil prices rose to the highest since late January and Brent jumped to their highest since early January on Tuesday amid hopes that top global producers will agree a coordinated output freeze. That helped to offset growing concerns about the record U.S. inventory. 
"U.S. crude futures ended the week 10 percent higher after settling 4 percent higher at $35.92 a barrel on Friday as strong U.S. jobs data spurred hopes of better demand growth and on technical buying after crude prices breached resistance levels on charts. 
"The price action was impressive this week. Especially getting through $35 a barrel," said John Kilduff, partner at Again Capital, a New York energy hedge fund."
It appears speculators are counting on production cuts by OPEC and Russia. If these cuts do not materialize, the oil price pattern detailed in the first chart above could result in oil prices falling back below the $30/bbl level as too much supply seems to be the main driver of the recent volatility in oil prices.


Sunday, January 31, 2016

Understanding The Disconnect In The Correlation Between Oil And Stock Prices

Recently a number of commentators on the weekly business shows have commented oil prices and the stock market have been moving in the same direction during the month of January. On the few days oil and stocks moved in opposite directions, the conclusion was this would be a good thing for the overall market. Not wanting to single out any one specfic strategist, but this past Monday, Bill Stone, chief investment strategist at PNC Wealth Management, noted on CNBC, "it's not clear whether the selling will subside for now because of the tight correlation between stocks and oil prices, which he says should break at some point (emphasis added)." This comment is similar to a number of other strategists.

So what is the point then? As the below chart shows, going back to the mid 1980's the price of oil and the price of stocks have a positive correlation of .66. It only has been since October of 2013 that this correlation broke down and reversed. Since the October 2013 time period, the correlation between oil prices and stock prices has been a negative .74. In other words, market participants should be rooting for higher oil prices and a return to the positive correlation that has been evident over the long run. In all seriousness though, investors should be aware of the fact that there is a high positive correlation between oil and stock price movements.

From The Blog of HORAN Capital Advisors

A number of factors can influence the price of oil, but stronger demand in an environment of stable supply can cause oil prices to rise. This often occurs when stronger economic activity is present. What seems to be occurring today is lower oil prices face downward pressure due to the continued increase in supply in spite of a significant reduction in drilling rig count. The first chart below shows global demand has continued to increase; however, supply growth is greater than the growth in demand. The supply/demand imbalance does not come into balance until late 2016. The second chart shows rig count (maroon line) has declined by more than 60%, i.e., 1,216 rigs, yet supply (green line) has continued to grow.

From The Blog of HORAN Capital Advisors

From The Blog of HORAN Capital Advisors

In conclusion, we believe the recent disconnect in the movement between stock and oil prices is influenced more by excess supply and not a decline in demand. The positive to draw from this one data point is economic activity is not contracting if one evaluates the oil consumption part of the economy. If lower oil prices continue to be realized, at least in the first half of this year, this should be a tailwind that supports consumer spending in other areas besides energy and supports steady economic growth this year.


Sunday, December 27, 2015

Midstream MLPs Potential Funding Hurdles

Stocks in Energy Master Limited Partnerships (MLPs) have experienced some of the worst declines of any sector this year. The below chart of the Credit Suisse X-Links Cushings MLP Infrastructure ETN (MLPN) is a clear example of the magnitude of the decline. From the ETN's high to its low this year, the ETN fell over 52%. In less than a month, and mostly the past week, MLPN has rebounded 19% yet remains 43% below its 52-week high.

From The Blog of HORAN Capital Advisors

Given the magnitude of the decline in MLPs investors are evaluating whether this is an opportunity to begin building positions in the asset class. One decision point revolves around technicals while the other is centered in evaluating the fundamentals of many MLPs themselves. Technically, the recent bounce in some MLPs is placing them near short term overbought levels. In my view it will be the fundamentals that drive the future long term returns of the asset class and it is here where the waters become a little murky.

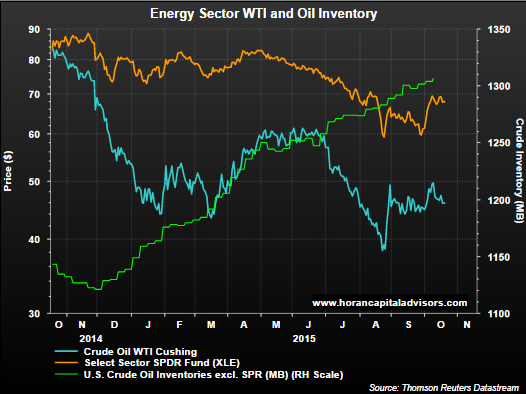
The growth of shale fracking has been a game changer for the natural gas and overall energy market in the U.S. The over supplied levels for both gas and oil has been written about ad nauseum this year, but suffice it to say the U.S. has abundant supplies of energy resources in the near term.

From The Blog of HORAN Capital Advisors

From The Blog of HORAN Capital Advisors

The consequence for exploration and production (E&P) MLPs is the increased supply is resulting in lower prices for their product, thus pressuring margins. Historically, the safe plays in MLPs were the midstream companies that essentially transported the product from the well head and then paid a toll based on the volume of oil/gas transported through their pipelines. Therein lies one question, if the E&P companies produce less, will less be transported by midstream MLPs, thus negatively impacting the revenue of the midstream MLPs?

Two additional issues are facing MLPs broadly that are related. As noted above a part of MLP growth has come from the booming natural gas segment, largely a result of shale fracking. In order to handle the growth, MLPs have increased their capital expenditure budgets and financed the expenditures via both equity and debt funding sources. This has occurred at the same time MLPs have strived to grow their distributions to shareholders.

Given the challenges facing many of the E&P MLPs, a few have cut distributions in order to funnel cash flow to capital expenditures due to the inability to access the credit markets without facing potential credit rating downgrades. Additionally, some of these MLPs have resisted issuing equity at these lower stock price levels due to the increased dilutive impact to existing shareholders. Also, the E&P companies will be facing an increasing need to roll over maturing debt.

From The Blog of HORAN Capital Advisors
Source: Ned Davis Research via Twitter

In reviewing the fundamentals then, one common measure used to evaluate MLPs is the debt to EBITDA ratio. In a 2013 Barron's article, Ned Davis Research opined,
“the debt-to-EBITDA ratio of the Alerian MLP Index goes a long way towards explaining returns. When the median stock in the index trades above 2.6 debt-to-EBITDA, MLPs have lost 10% on average. When it’s been below 2.6, they’ve gained 20%...” 
One midstream oriented MLP index is the Cushing MLP Infrastructure Index and all but one MLP in that index has a debt to EBITDA ratio greater than 2.6. Half of the MLPs have debt/EBITDA ratios greater than 5.0 and several are double digits.

From The Blog of HORAN Capital Advisors

The next question is what level of financing will be needed going forward to fund growth? The above file contains detail on cash flow from operations versus capital expenditures. In total, the gap that needed to be funded in 2015 with debt or equity is in excess of $11 billion. I also included a more detailed quarterly cash flow report for Energy Transfer Partners (ETP) in order to provide readers with insight into the funding sources and uses of cash by the company. A number of midstream MLP's have similar funding source breakdowns between equity and debt issuance.

As noted earlier in this post, debt is likely to be a more restrictive funding source, so equity is the alternative. With MLP prices depressed, MLP’s are less likely to issue equity due to the level of dilution. The alternative is to cut cap ex, cut the dividend or a combination of the two. Given the market’s negative reaction to recent distribution cuts by several MLPs, managements at MLP companies are likely to take a harder look before cutting distributions and more likely focus on cap ex first. Cutting capital expenditures has the potential negative impact of constraining future growth; however, this is likely what is needed given the U.S. energy glut.


Saturday, November 28, 2015

Gold And The Equity Markets

Gold prices have not been immune to the broader issues facing the overall commodity market. Year to date, the price of gold is down 10.8% while the broader CRB Commodity Index is down 20.3%. A part of the issue negatively impacting the price of gold is output is outpacing demand. With the decline in the price of gold the cost to extract gold exceeds the market price in many cases.

From The Blog of HORAN Capital Advisors

More importantly though, gold is mostly transacted in US Dollars and the strength in the Dollar is a headwind for the price of the metal. The light blue line in the below chart represents the trade weighted Dollar Index compared with gold prices (yellow line). The lines show gold price weakness as the Dollar strengthens. Gold has a negative .65 correlation to the trade weighted Dollar index. With the Federal Reserve nearing lift off for U.S. rates, additional Dollar strength will likely be an outcome into 2016.

From The Blog of HORAN Capital Advisors

Additionally, the red line in the above chart shows the ratio of the S&P 500 Index to the price of gold. This ratio has a positive correlation to the trade weighted dollar and is partly a result of weaker gold prices as the Dollar rises. Another important factor that contributes to the upward sloping red ratio line is a rising S&P 500 Index. The obvious factor that contributes to higher equity prices is the growth in earnings and therein lies the issue for equity prices. As the below chart shows, earnings growth for the S&P 500 Index will be negative for two successive quarters if earnings are negative for the fourth quarter. This would be the first back to back quarterly earnings decline since 2009. The second chart below shows 12-month forward earnings estimates for the S&P 500 Index and the negative growth expectations are weighing negatively on recent S&P 500 returns.

From The Blog of HORAN Capital Advisors

From The Blog of HORAN Capital Advisors

A large part of the earnings weakness is being attributed to the stronger Dollar and its negative impact on multi national companies as they convert foreign earnings back to the Dollar and the negative earnings issues impacting much of the energy sector. As the calendar rolls into 2016, both the currency and energy comparisons should be less of a headwind on a year over year basis.

Absent some type of shock or fear event, gold prices, like many commodities, are likely to remain pressured due to a stronger Dollar and an excess gold supply. For the S&P 500 Index, and equities broadly, a resumption of earnings growth going into 2016 will be necessary for equities to move higher. 


Tuesday, October 20, 2015

Crude Oil Inventories Continue To Rise

At mid-year of 2014 West Texas Intermediate (WTI) crude oil prices were trading over $100 per barrel. Just over a year later, WTI is now priced at just under $50 per barrel. This steep fall in crude prices has confounded the market from the standpoint of the magnitude of the price decline. Is the price decline simply a reaction to elevated supply due to the growth of fracking or has worldwide oil demand fallen as a result slowing global growth? We briefly address this issue in our Fall Investor Letter, but following is a closer look at oil supply and the performance of energy related investments.

An important data point will be the release of the weekly Petroleum Status Report by the Energy Information Administration (EIA) on Wednesday's at 10:30 am. Last week's EIA report noted "U.S. commercial crude oil inventories (excluding those in the Strategic Petroleum Reserve) increased by 7.6 million barrels from the previous week. At 468.6 million barrels, U.S. crude oil inventories remain near levels not seen for this time of year in at least the last 80 years (emphasis added.)

The first two charts below compare the performance of the SPDR Energy Sector ETF (XLE) to the percentage change in the price of WTI. As the first chart shows, the SPDR Energy Sector Fund ETF held up better as WTI's price began to fall beginning in 2014. One question for investors is whether the relative outperformance of XLE is justified or might it resumes its decline in order to catch up to the fall in WTI's price. The second chart compares the same two assets but on a shorter six month time frame. In this chart both XLE and WTI are once again trading in sync with one another.

From The Blog of HORAN Capital Advisors

From The Blog of HORAN Capital Advisors

At HORAN we do believe the issues impacting oil are more supply related, yet acknowledging the continued "bump along the bottom" economic growth rate around the world. Iran indicates it will increase supply at any cost and Saudi Arabia continues with the desire not to reduce production levels. The green line in the below chart shows the rig count in Saudi Arabia and the chart clearly shows they have not reduced rig levels unlike in the U.S. and globally.

From The Blog of HORAN Capital Advisors

Finally turning to supply, the green line in the below chart shows the unabated oil inventory growth in the U.S. since late 2014. The currently high inventory levels seem not suggestive of an oil market where crude prices are likely to move higher in the near term. And this downward pressure on oil prices will likely be a continued headwind for energy related investments.

From The Blog of HORAN Capital Advisors


Friday, May 29, 2015

Lower Oil Prices Ahead?

On Thursday the EIA Petroleum Status Report shows a fourth week of oil inventory draw-down with a decline of 2.8 million barrels. Expectations were inventories would decline 857,000 barrels.

From The Blog of HORAN Capital Advisors

This decline occurred in spite of the continued increase in production as noted by the orange line in the below chart. Notable in the chart is the fact production continues to increase in spite of the sharp drop in rig count (blue line). The recent inventory draw-down may be due to seasonal factors as the busy summer travel season approaches as well as temporary production declines in sand fields in Canada.


Friday, April 24, 2015

A Further Rise In Crude Oil Prices Facing Headwinds Near Term

Oil rig count has fallen dramatically in the U.S., yet oil supply is continuing to pile up nearly unabated. The market is of the belief that this decline in rig count will ultimately put a halt to the supply growth.

From The Blog of HORAN Capital Advisors

Rex Tillerson, CEO of Exxon Mobil (XOM), recently spoke at the IHS CeraWeek conference in Houston, TX. Tillerson believes oil prices are likely to remain at a lower level for the next several years. Additionally, ConocoPhillips (COP) CEO noted the shale fracking industry has a large number of wells that will be completed once oil prices do rise. This alone is likely to place a cap on the rise in the price of oil.

Lastly, as the below chart clearly shows, in spite of the lower level of oil prices, Saudi Arabia is determined to keep the supply of oil flowing as evidenced by the country's rig count growth (green line.) Their goal is to force fracking companies out of business in an effort to eliminate this swing supply.

From The Blog of HORAN Capital Advisors

With WTI recently rebounding from the mid $40 per bbl price to mid $50's level, further oil price increases could face some headwinds in spite of the decline in global rig count (red line.) In the EIA Petroleum Status Report released on Wednesday, crude oil inventories rose 5.3 million barrels. As noted by Econoday,
"The string of inventory builds continues for oil, up a fat 5.3 million barrels in the April 17 week to 489.0 million which is the 14th straight build and yet another 80-year high [emphasis added]. The build is due to yet another rise in oil imports and also in part to an easing of refinery demand for oil. But refineries are still busy, operating at 91.2 percent of capacity."