Thursday, January 31, 2013

Investor Letter: 4th Quarter 2012

For the year 2012 the S&P 500 Index returned 16% and the market's gain has continued in 2013 with the S&P 500 increasing over 5% in January. If there is truth to the market adage of "so goes January, so goes the rest of the year," the balance of 2013 will be rewarding for equity investors. According to the Stock Trader's Almanac, since 1950, stocks have finished lower for the year only three times after posting gains in January. The January effect has been correct 89% of the time since 1950, suffering only seven major setbacks.

As noted in our Investor Letter, and as we analyze the capital markets and project expected long-term returns and risks, at HORAN we believe we are in an environment that favors equities and alternative investments over bonds. Two components of risk, inflation risk and interest rate risk, give us concern about the prospect of positive real returns in diversified fixed income portfolios. Potential short-term shocks like the debt ceiling debate and sequestration in Washington may be catalysts for an equity market pullback. In our  Investor Letter, we attempt to outline our case that supports equities over the longer term.

The complete Letter can be accessed directly from our website at this link: 4th Quarter Investor Letter.

From The Blog of HORAN Capital Advisors


Sunday, January 27, 2013

Market Corrections In Post Election Years

In spite of the strong market advance from its low in mid November, post election year markets have experienced their largest decline from the market's prior year close. In a recent report by Standard and Poor's, they note,
"Since 1900, the S&P 500 recorded its deepest median YTD decline during the first year of the four-year presidential cycle at -12% versus declines of 11%, 3% and 4% for years 2, 3, and 4, respectively."
From The Blog of HORAN Capital Advisors

Investor sentiment seems to have improved since Congress resolved the fiscal cliff over hang on the market at year end. Next up will be the issue of sequestration in early March. Coincidentally, in a post election year, the market tends to experience its weakest performance in the first quarter.


In a report from Chart of the Day from a few years ago, it was noted,
"Since 1900, the stock market has tended to underperform from early January to late February and again from early August to early November during the average post-election year. Some parts of the year have, on average, outperformed. The most notable period of outperformance has occurred from late March to late May. In the end, however, the stock market has tended to underperform during the entirety of the post-election year. One theory to support this behavior is that the party in power will tend to make the more difficult economic decisions in the early years of a presidential cycle and then do everything within its power to stimulate the economy during the latter years in order to increase the odds of re-election."
From The Blog of HORAN Capital Advisors

Equity valuations do look attractive at this point in time; however, Q4 earnings reports have only shown low single digit increases to date. The market's future direction will likely depend on the outlook companies provide for the balance of the year.


Friday, January 25, 2013

Running Of The Bulls

Since mid November of last year, the S&P 500 Index has advanced nearly 11%. Due to this strong rise in the market and continued strength in the month of January, 2013, investors and strategists believe a correction or pullback is increasingly likely. A part of the market's strength is due to cash coming off the sidelines and into equities as a result of investors' building cash in the run up to the fiscal cliff. One "technical" factor cited for a potential correction is the high percentage of stocks trading above their 50-day moving average. As the weekly data shows in the below chart, 92.2% of S&P 500 stocks (yellow line) are trading above their 50 day M.A. which is one signal of an overbought market. The second chart displays the percentage of stocks above their 150-day M.A. The charts certainly seem to show corrections can occur at these high percentages.

From The Blog of HORAN Capital Advisors

From The Blog of HORAN Capital Advisors

For investors then, one important question is whether stocks are owned for a short term trade or owned for the long run. I wrote a post on September 21, 2009 titled, A View Of The Market, which discussed this very same issue. At that time I wrote,
"It seems the most frequent comment I receive of late is "the market is due for a pullback".... If you are a contrarian, this is good. The more investors are skeptical of the advance, the more likely it could move higher. However, as the chart shows, this advance looks like it could or should be topping out."
The chart in that earlier post is below.


Notable in the chart is the fact the high percentage of stocks trading above these moving averages can run for an extended period of time. Additionally, as the below four plus year chart of the S&P 500 index shows, these corrections can be small relative to the longer term potential return in the market.

From The Blog of HORAN Capital Advisors


Monday, January 21, 2013

Are Favorable 2013 Equity Fund Flows Indicative Of Investor Sentiment Shift?

Recent media reports have noted the strong equity fund flows that have occurred during the first few weeks of January. Thomson Reuters' Lipper Fund Flow report cautions investors not to read too much into the positive equity flows to date. According to Lipper the first two weeks of January make the positive equity flows the largest two-week increase since April 2000. The actual flows show "$18.3 billion moved into equity mutual funds for the week ending January 9, i.e., $10.78 billion in ETFs and $7.53 billion in stock mutual funds.  Another $3.76 billion moved into stock mutual funds for the week ending January 16."

From The Blog of HORAN Capital Advisors

The Lipper report highlights a few cautionary points regarding these early year fund flows:
  • "First, while investors watch where the so-called smart money is heading, individual mutual fund flow trends have not historically earned that title. In fact, the retail crowd has often jumped onto certain trends at precisely the wrong time, including the technology stock run-up to the March 2000 market highs."
  • "Second, annual and quarterly rebalancing activities may distort what appear to be secular trends, such as the [reports] mention [of] 2010-2012 exodus from equity Large Cap Growth and Value, which may resume in the coming weeks."
  • "Finally, there is historic evidence of the trend from active to passive investment management continuing, though ETFs are as much a trader’s vehicle as they are an investor’s solution. This makes reading the tea leaves of ETF fund flows more challenging due to the potential to fluctuate more than mutual fund flows."
Lastly, Lipper's report notes beginning in March of 2011 through end of 2012 equity mutual funds have experienced 22-months of outflows. The report discusses the consequences of breaking this outflow streak.

Source:

Equity Mutual Fund Inflows – Less Than Meets the Eye
AlphaNow
By: John Kozey
January 21, 2013
http://alphanow.thomsonreuters.com/2013/01/equity-mutual-fund-inflows-less-than-meets-the-eye/


Sunday, January 20, 2013

Ed Hyman And Dennis Stattman Part II: Stand Against The Crowd

Last week I posted part one of Consuelo Mack's WealthTrack interview with Ed Hyman of ISI Group and Dennis Stattman of Blackrock. This post features part two of the interview and contains an interesting discussion on market opportunities outside the U.S. Dennis Stattman has a very bullish view on Japan and believes it is a result of the recent landslide victory for the LDP while Ed is bullish on China.

A part of the bullish thesis on Japan is due to the country jumping on board the the monetary easing train that most countries around the globe have bought into of late. Also, Dennis believes Japanese equities are way under owned as investors have given up trying to figure out the bottom of Japan's twenty plus year bear market. One interesting fact noted by Dennis is the average one day combined trading volume of Japan's 100 largest companies is less than the average one day volume of Apple (AAPL). Any incremental new investment flows into Japanese equities would certainly push them higher. The interview is well worth watching as 2013 begins to unfold.


Saturday, January 19, 2013

Now Fund Managers Turn Positive On Equity Markets

The past two years certainly provided investors and fund managers with a sufficient amount of news headlines that could move the equity markets to the downside. The debt ceiling debate in 2011 (now being repeated in 2013), the election, the fiscal cliff and budget sequestration (kicked to early March 2013.) During this time period individual and professional investors remained cautious on the equity markets. Bond investments have been favored over stocks as the mood was "risk off".

From The Blog of HORAN Capital Advisors

With the calendar turning to a new year what is the mood of investors? In a recently released survey of fund managers by BofA Merrill Lynch, they find,
"The new year sees asset allocators assigning more funds to equities than at any time since February 2011, while their confidence in the world’s economic outlook has reached its most positive level since April 2010. Investors’ appetite for risk in their portfolios is now at its highest in nine years..."
During this period from April 2010 through early 2013, when the appetite for risk was low, the equity markets found a way to generate strong returns for investors. As the below chart shows, the S&P 500 Index and the Dow Jones Industrial Average generated price returns of 27% and 25%, respectively.

From The Blog of HORAN Capital Advisors

During the first few weeks of 2013, the equity markets continue to move higher.

From The Blog of HORAN Capital Advisors

Investor behavior biases have likely played a role in avoiding equities over the last few years while finding them attractive now. Investors are rightfully concerned about large losses as losses can do damage to one's retirement assets. Positive sentiment can also be attributed to the fact that last year the S&P 500 was positive for the entire year, i.e., it did not close in the red on a year to date basis on any single day, and so far in 2013 the streak continues.  According to an article by Avondale Asset Management,
 "While there was little mention of the S&P 500's perfectly positive year, the occurrence is actually pretty rare. Data for the S&P 500 since 1957 produced only three other years where the index started the year positive and never closed negative on a YTD basis during the year."
As the longer term market chart above shows, a sell in May strategy certainly did not work in 2012. Might this be a year this seasonal approach works? These types of allocation moves are tactical ones and there is a downside if one is wrong. Barry Ritholtz, Director of Equity Research at Fusion IQ, discusses some of his mea culpas in 2012 and one of them was some of his tactical calls.

At Dorsey Wright's Systematic Relative Strength blog he comments on a Time Magazine article that highlighted research that shows "the more hands Texas Hold'em poker players win, the more money they lose." Wright surmises "investors will often prefer a system with 65% winning trades over a system with 45% winning trades, even if the latter method results in much greater overall profits." The study author, Kyle Siler of Cornell University concludes, "People overweigh their frequent small gains vis-à-vis occasional large losses."

For investors then, removing emotion from one's decisions is important in order to attain returns that meet retirement goals and objectives. Investors should develop an investment policy that can be used as a beneficial road map to follow in times of difficult markets. Difficult markets are not only ones that are declining, but also, feeling left behind in strongly rising markets as well.


Saturday, January 12, 2013

Significant Increase In Positive Dividend Actions In Q4 2012

Dividends were certainly a focus in the fourth quarter of 2012. One reason for this was the anticipated higher dividend tax rate associated with going over the fiscal cliff. Standard and Poor's reports extra dividends in Q4 were the most since 1955. The below chart shows positive dividend actions in Q4 totaled 1,262 versus 649 in Q4 2011, a 94% increase.

From The Blog of HORAN Capital Advisors

On a calendar year basis the strength in positive dividend actions has been evident since the height of the financial crisis in 2009 when positive actions reached a low of 1,191.
From The Blog of HORAN Capital Advisors

In regards to cash payments and payout rates, Howard Silverblatt, Senior Index Analyst for S&P Dow Jones Indices notes,
“Dividends had a great 2012 with actual cash payments increasing 18% and the forward indicated dividend rate reaching a new all-time high. Payout rates, which historically average 52%, remain near their lows at 36%. At this point, even with many January payments paid in December, we should see 2013 as setting another record for regular cash dividends.”

Source:

Fourth Quarter 2012 Dividend Rate Increases $8.4 Billion
S&P Dow Jones Indices
By: David R. Guarino, Soogyung Cho, Howard Silverblatt
January 7, 2013


Forecast For 2013 By Ed Hyman And Dennis Stattman

Consuelo Mack of WealthTrack recently interviewed Ed Hyman and Dennis Stattman on her program to provide their views on 2013. Ed has been rated as the number one economist for over three decades. Dennis has had a successful track record managing Blackrock's Global Allocation Fund (MALOX). The below video is part 1 of her interview with part 2 scheduled for next week.

In the interview Ed Hyman notes the market is in a "climb a wall of worry" phase. He believes many of the issues impacting investors over the last three years are still in place today. He states the last three years saw the equity markets do better in both the first and fourth quarters of the year. Given the strong start to 2013, he believes this could be the case again this year. A part of this positive strength in the markets is due to central banks expanding the money supply or injecting liquidity into the economy. Over the last five weeks, the U.S. money supply has increased by $200 billion (that is $2 trillion on an annual run rate basis.)

Dennis Stattman believes equity valuations look attractive; however, he is concerned with the sustainability of corporate profits as they are at a level, as a percentage of GDP, last seen after WWII. He does believe earnings expectations for companies may be too high. One segment of the market Dennis believes is turning into a tailwind for the economy is the improvement in housing. He believes housing formation is in a improving trend with home buyers now believing they better buy versus wait. This buy versus wait psychological shift will be positive for the economy do to the influence of housing on overall economic activity.


Saturday, January 05, 2013

Fixed Income Investors May Be In For A Surprise

Since the financial crisis that saw the market (S&P 500 Index) bottom in March of 2009, investors have allocated more of their investment dollars to bonds versus stocks. This allocation decision has resulted in investors missing out on the much stronger returns generated by stocks. Out of the last four years only 2011 saw bonds beat stocks in the U.S. investment market.

From The Blog of HORAN Capital Advisors
table correction: 1/10/2013

This allocation decision made by investors is confirmed by fund flow data as shown below.

From The Blog of HORAN Capital Advisors

From The Blog of HORAN Capital Advisors

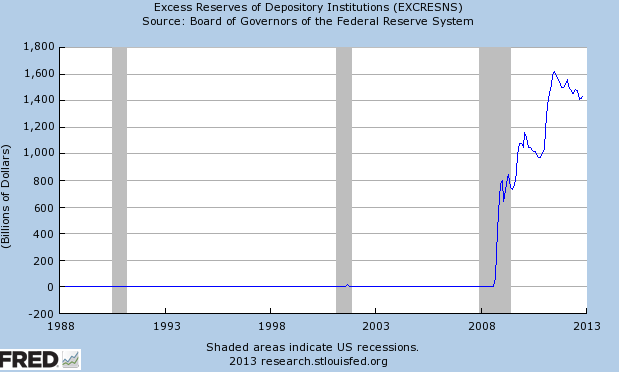
Complicating the analysis for investors on where to allocate investment dollars has been the Federal Reserve's involvement in artificially forcing interest rates lower through Quantitative Easing activities. Looking at the monetary base, however, it appears the Fed may have stepped away from easing recently in spite of the Fed's rhetoric.

From The Blog of HORAN Capital Advisors

The monetary base expansion has not led to higher inflation as the turnover or velocity continues to decline. The significance of velocity is outlined in an earlier blog article,  Money Supply Causing Concern With Future Inflation.

From The Blog of HORAN Capital Advisors

In fact, St. Louis Fed President James Bullard indicated as much in a recent interview on CNBC. A part of his concern is the improving unemployment situation, albeit at a very slow pace, and maybe improved commercial lending activity at commercial banks. It is the banks' deployment of excess reserve into loans that will have a positive impact on the velocity of the monetary base.

From The Blog of HORAN Capital Advisors

From The Blog of HORAN Capital Advisors

Then what is the significance to investors? Potentially higher interest rates. The consequence of higher interest rates is a decline in the price of fixed income (bonds) prices as prices move inversely to interest rates. In the short term this appears to be occurring. Since early December, the price of the 10-year treasury has declined by 2.18%.

From The Blog of HORAN Capital Advisors

Investors underweight equities should consider the negative impact of higher interest rates on their fixed income investments. With the fiscal cliff recently avoided, equities responded favorably. However, Washington has ensured investors of more uncertainty in the near term with debate on the debt ceiling, cuts associated with sequestration and the federal budget's continuing resolution negotiation. All of these may provide investors the opportunity to consider higher equity exposure if they are underweight this asset class. Keep in mind the higher taxes associated with the fiscal cliff agreement and additional taxes associated with the health reform act have the potential to reduce economic growth. This alone could be negative for the equity markets though.


Tuesday, January 01, 2013

Dogs Of The Dow For 2013

Now that 2012 has come to a close, the Dogs of the Dow are set for 2013. Two companies are new additions this year and they are Hewlett-Packard (HPQ) and McDonald's (MCD). The two companies falling out of the top ten yielding stocks are Procter & Gamble (PG) and Mondelez (MDLZ).


The Dow Dogs of 2012 underperformed the Dow Jones Index by 1.6 percentage points. The Dow returned 7.3% versus the 2012 Dow Dogs return of 5.7%. This is far different than the 2011 return when the Dogs of the Dow returned 16.3% versus the Dow's return of 8.4%.


Most Popular Posts In 2012

Following is a list of the blog posts from last year receiving the largest number of hits from our readers. The last two posts received a high number of hits, but did not make the top five. However, the content of the last two posts may be timely reading for investors.


Monday, December 31, 2012

Thank You To Our Clients, Prospects And Readers Of Our Content

As 2012 comes to a close, all of us at HORAN want to thank our clients for allowing us to work with them this past year. We wish all of our clients, prospects and readers of our content a Happy, Healthy and Prosperous New Year!

The past 12-months were certainly volatile with the S&P 500 Index up 13% through early April, then up only 2% by the end of May. As the market closes out the year today, the S&P will be higher by more than 15%. Not a bad year for equity investors. Fixed income investors enjoyed good returns due to our exposure to high yield, floating rate and global bonds.

At HORAN, all of our investment categories generated a positive return over the course of the year. I suppose one could say it seemed like a rising tide lifted all market segments: equity, fixed and alternatives. We did steer clear of commodities and that seemed to be a winning decision. Soft commodities had a difficult year while Gold and Silver did generate positive returns, but less than the market and with higher volatility. Our lowest returning investment was our absolute return investment. More detail on 2012 and more importantly, our outlook for 2013, will be forthcoming in our fourth Quarterly Investment Letter.

Again, thank you and Happy New Year to our clients and to the readers of our content.


Volumes Near Ten Year Low

Equity volume for the NYSE is closing out 2012 at near a ten year low.  Investors seem to be giving up on the equity markets if this volume data is any indication.

From The Blog of HORAN Capital Advisors
Data Source: NYSE

Related to this low equity volume is the continued flow of funds out of equity mutual funds. The equity outflows appear to be finding their way into fixed income mutual funds.

From The Blog of HORAN Capital Advisors

Lastly, margin debt as of November 2012 is at a level last seen prior to the Lehman crisis. In addition to the high margin debt level, net free credit is also negative. The takeaway from this is these margin investors are mostly fully invested at this point in time, i.e., limited additional cash to push the market higher. Investors should keep in mind that margin debt is a better longer term indicator (at least 1-year) of potential market performance.

From The Blog of HORAN Capital Advisors
Data Source: NYSE


Sunday, December 30, 2012

Dividend Strategies Underperform In 2012

One of the hot investment topics of 2012 has centered around dividend paying stocks. With the Federal Reserve pursuing a near zero interest rate policy, the yield on treasury bonds as well as cash have been pegged at a very low level. For investors relying on income, some investment strategists have extolled the virtues of dividend paying stocks with many of the dividend strategies generating yields higher than treasury bonds and cash. For example, the iShares Dow Jones Select Dividend Index (DVY) yields more than 3% while the 10-year treasury yields little more than 1.5%. Now bond risk is a far cry from equity risk; however, the point of this commentary is one might expect dividend paying stocks to be top performers given all the attention they have received this year. Top performers they haven't been though.

As the below chart comparing the Powershares Dividend Achievers Portfolio (PFM) to the S&P 500 Index shows, the PFM ETF has underperformed the S&P index over the last 12-months (top chart). However, over a 2-year period (bottom chart), the PFM dividend achievers portfolio has generated a return better than the S&P 500 Index.

From The Blog of HORAN Capital Advisors

For investors then, keep a longer term focus in mind. Outperformance can be achieved while at the same time assuming a lower level of risk, that is, a lower standard deviation. The end result is an investor is likely to generate a higher risk adjusted return. Some Modern Portfolio Theory statistic for the Dividend Achievers Index is outlined below.

From The Blog of HORAN Capital Advisors

Lastly, the Dividend Achievers strategy has outperformed the S&P 500 Index in each down market going back to 2011.

From The Blog of HORAN Capital Advisors

Importantly, for investors that rely on regular distributions from their assets, minimizing downside returns is important. Certainly there are other investment allocation strategies that can be employed that will minimize an investor's downside returns, i.e., holding cash, alternative hedged investments, etc., however, for the core equity portion of ones portfolio, employing a dividend focused strategy has the potential to reduce the overall portfolio's potential downside volatility.


Dividend Growth More Consistent Than Buybacks In Q3 2012

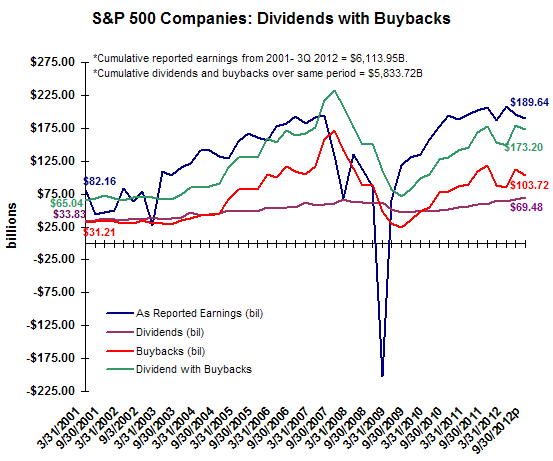
Late last week Standard and Poor's reported dividend and buyback data for S&P 500 companies through the third quarter of 2012. Year over year and quarter over quarter dividend growth was reported at 17.4% and 3.2% respectively. Buyback activity was actually lower on a year over year and quarter over quarter basis. YOY buybacks declined 12.4% and QOQ buybacks fell 7.2%.

Howard Silverblatt, Senior Index Analyst at S&P Dow Jones Indices notes, "Company buyback activity has been erratic over the past three months, given the continued uncertainty of the fiscal cliff and the potential impact on spending, companies may have taken a cautious approach to stock buybacks in the fourth quarter. In the background, however, is some talk of companies needing more shares to meet employee options, with more being exercised near year-end due to the anticipated tax change."
From The Blog of HORAN Capital Advisors

Silverblatt also notes the top heavy nature of the buyback activity. For the quarter the top 20 companies in the S&P 500 Index accounted for over 53% of the quarter's buybacks.

From The Blog of HORAN Capital Advisors


Saturday, December 29, 2012

A Look At The Top 1% Of Taxpayers, Government Revenues/Expenses And The Deficit

Politicians have just a few days remaining to come up with some resolution to the fiscal cliff facing the country. It appears the resolution will be another "can kick" that mostly increases taxes. The President's income break point is often stated to by $250,000 while House Speaker John Boehner's Plan B had higher taxes for those with incomes above $1 million. The problem with focusing only on increasing taxes and generating more revenue is the fact that the expense side of the budget needs to be dealt with as well. The revenue generated from the higher proposed tax rates would only fund the government for eight days. As the below chart shows, expenses have spiked significantly subsequent to the recession with a deficit that remains alarmingly high at over $1 trillion per year.

From The Blog of HORAN Capital Advisors

Mark Perry, Professor of Economics at the University of Michigan, recently analyzed IRS data available through 2010 for taxpayers in the top 1% versus those in the bottom 95%. Taxpayers with income above $221,000 would fall in the top 1% of income earners in 2010. What his analysis of the data shows is:
  • "the 1.35 million taxpayers that represent the highest-earning one percent of the Americans who filed federal income tax returns in 2010 earned 18.9% of the total gross income and paid 37.4% of all federal income taxes paid in that year."
  • "the 128.3 million taxpayers in the bottom 95% of all U.S. taxpayers in 2010 earned 66.2% of gross income and that group paid 40.9% of all taxes paid."
  • "in other words, the top 1 percent (1.35 million) of American taxpayers paid almost as much federal income tax in 2010 ($354.8 billion) as the entire bottom 95% of American tax filers ($388.4 billion)."
  • "about half (58 million) of the bottom 95% of American “taxpayers” paid nothing or got a tax refund."
The below chart, which appears in his article, details the the increasing share of taxes paid by the top 1% of taxpayers since 1980.

From The Blog of HORAN Capital Advisors

Broadening the base of taxpayers, even at a minimal level, would get more of the population in tune to the budget consequences facing the U.S. The below chart displays a ten year time period, but the same holds true going back to the 1980's, noting there has not been a single year since the 80's where the government actually cut spending. That is, the absolute dollar level of spending never declined. The spending side of the government's ledger is as large of an issue as is the revenue side.

From The Blog of HORAN Capital Advisors


Wednesday, December 26, 2012

A Need To Focus On Government Outlays

It would be hard to envision that the public has not heard about the fast approaching fiscal cliff. What seems lost in the narrative of the media and their focus on raising tax rates, is the fact government spending continues to consume a larger share of the government's budget.

As the below chart indicates, the CBO is forecasting social security and medicare payments to account for a larger and larger share of the budget as far as the eye can see. Addressing the growth in these programs will be required in order to provide any dent in the current budget deficit.

From The Blog of HORAN Capital Advisors

The result of going over the fiscal cliff doesn't address the spending either. The cliff impact has tax hikes exceeding spending cuts by a 3:1 margin. One reason for this outcome is the fact Washington's "baseline" budgeting definition means simply lowering the growth rate of spending counts as a cut in spending. A recent Wall Street Journal article, The Baseline Budget Con ($), addressed this budget gimmick.

From The Blog of HORAN Capital Advisors


Saturday, December 22, 2012

Fiscal Cliff Not Resulting In Dividend Cliff

One of the most popular investment topics in the fourth quarter has to do with the impending fiscal cliff discussion taking place in Washington, DC as can be seen in the Google Trends graph below. One area of interest for investors is the impact on the taxation of dividends if Washington policy succumbs to going over the cliff. Going over the cliff would result in the tax rate on dividend income increasing to as high as 43.4% versus the current 15% rate.


Interestingly, this potentially higher tax rate does not seem to be having a "negative" impact on the long term dividend policy for companies. Factset Research notes in their Dividend Quarterly report for Q3:
  • aggregate dividends per share (“DPS”) grew 15.5% year-over-year at the end of Q3.
  • the number of companies paying a dividend in the trailing twelve-month period again surpassed 400 (80% of the S&P 500 index).
  • the S&P 500 also hasn’t shown a slowdown in companies initiating dividend payments. In Q3, 3.0% of non-payers “initiated” dividends, which is nearly triple the average over ten years (1.2%).
  • the aggregate dividend payout ratio is 2.0% below the ten-year median, it is at its highest level (29.1% at the end of Q3) since the recession (when payout ratios were distorted by low aggregate earnings during the recession...).
  • while there have been a number of companies that are signaling short-term changes in dividend policy or a shift towards more share buybacks..., a majority of companies have not yet responded, including the top ten dividend-payers in the S&P 500.
  • the aggregate, forward twelve-month DPS estimate for the S&P 500 was 10% above the actual trailing twelve-month (“TTM”) payout at the end of November, which is a premium that is well above the ten-year average of 3%... Also, even when excluding the periods during the financial crisis (when forward DPS estimates fell below trailing figures), the forward consensus premium is in-line with the stabilized average starting in 2011.
    One reason dividend practices may not be changing for a large majority of companies may be due to the fact that many shareholders own company stock in retirement accounts and/or shares are held by foreign investors. In Factset's Dividend Quarterly one Treasurer cites this very fact.

    Lastly, just to reiterate a point about dividends versus buybacks we have made on this blog in the past is the fact divdend payments are more consequential when evaluating companies. We prefer dividends since company practices around their dividend policy offer more insight into potentially negative financial outcomes since firm's are less likely to cut dividends. For example, companies may take on debt in order to maintain adherence to a certain dividend growth rate. This may result in debt/equity levels increasing as well as payout ratios increasing. These are red flags for investors and may enable investors to reduce positions before negative financial results are reported. Conversely, company buyback announcements maybe just that and do not equate to a longer term commitment of a company's cash flow. It is far easier for a company to come up short on their buyback program than to announce a change in their dividend policy. As the below chart notes, the number of companies making buybacks and the aggregate dollars spent on buybacks has been on the decline since the fourth quarter of last year.


    Source:

    Factset Dividend Quarterly (PDF)
    By: Michael Amenta, Research Analyst
    Facset Research
    December 19, 2012
    http://www.factset.com/websitefiles/PDFs/dividend/dividend_12.19.12

    Factset Buyback Quarterly (PDF)
    By: Michael Amenta, Research Analyst
    Facset Research
    December 20, 2012
    http://www.factset.com/websitefiles/PDFs/buyback/buyback_12.20.12


    Sunday, December 16, 2012

    Technology Sector Largest Contributor To S&P 500 Yield

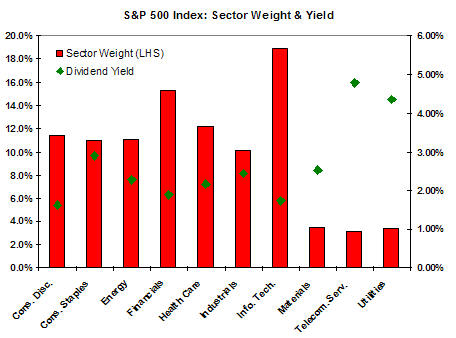
    As of December 11, 2012, the dividend yield for the S&P 500 Index equaled 2.27%. The largest contributor to the index's yield is now the technology sector, contributing 14.6% of the index's dividend income. This compares to the technology sector's income contribution at the end of 2011 of 10.29%. The sector experiencing the largest decline in contribution to the index yield is the consumer staples sector, declining from 15.6% in 2011 to 14.0% as of the close on 12/11/2012.

    From The Blog of HORAN Capital Advisors

    Given the technology sector's weighting in the index at 18.9%, and the popularity of dividends, it is not surprising that technology stocks are a significant contributor to the income yield for the index in spite of the tech sector having the second lowest yield at 1.74%. Additionally, the index is cap weighted and three of the top 10 index stocks are technology ones, Apple (2.1% yield), IBM (1.8% yield) and Microsoft (3.4% yield). These three stocks account for nearly 40% of the weighting of the stocks in the technology sector.

    From The Blog of HORAN Capital Advisors

    Data Source: Standard & Poor's


    Monday, December 10, 2012

    The Arithmetic Of Equities

    The research paper noted below, a good read, has been making the rounds over the weekend. The report discusses bond valuations relative to stocks and when one asset class appears more attractive than the other. The paper's author, Andrew J. Redleaf of The White Box Advisor, states he is really a "bond guy" but notes the following:
    "Basically I am a bond guy. I like fat coupons. And I like return of principal. But I take my bonds where I can find them. And these days the place to find fat coupons and return of principal is among blue chip equities."
    Arithmetic-of-Equities

    h/t: Market Folly