Sunday, February 19, 2012

$4 Gasoline Has Negative Impact On Confidence And Retail Sales

The recent rise in oil prices and subsequent increase to near $4 per gallon for regular unleaded gasoline is likely to negatively impact consumer confidence and retail sales. The below chart shows the negative influence increasing gasoline prices (inverted on chart) has on consumer confidence.

From The Blog of HORAN Capital Advisors

The negative impact on confidence also negatively impacts retail sales when gasoline reaches $4 per gallon. Note, gasoline prices lead retail sales by one month in the below chart.

From The Blog of HORAN Capital Advisors

Lastly, as noted in an earlier post, declining confidence often translates into weaker equity prices.

From The Blog of HORAN Capital Advisors


Saturday, February 11, 2012

Volatile Equity Market Returns

Absent the significant market contraction in 2008/2009, both the Dow and S&P 500 Index have generated decent returns. For investors though, the equity market pullback during the financial crisis period of '08/'09 remains top of mind. As the below tables show, the year over year returns for these two indices have been pretty strong resulting in 3-year annualized returns in the mid-teens. Unfortunately, the significant decline during the financial crisis has resulted in no return over the four and five year time period.

returns 1 31 2012

The Chart of the Day puts this most recent rally in perspective in their below commentary and chart.
"The Dow made another post-financial crisis rally high Thursday as it approached the 13,000 level. To provide some perspective to the current Dow rally that began back in early October 2011, all major market rallies of the last 111 years are plotted on today's chart. Each dot represents a major stock market rally as measured by the Dow. As today's chart illustrates, the Dow has begun a major rally 28 times over the past 111 years which equates to an average of one rally every four years. Also, most major rallies (78%) resulted in a gain of between 30% and 150% (29.8% to 150.5% to be exact) and lasted between 200 and 800 trading days (9.5 months to 3.2 years) -- highlighted in today's chart with a light blue shaded box. As it stands right now, the current Dow rally (hollow blue dot labeled you are here) would be classified as well below average in both duration and magnitude."
dow rallies

At HORAN Capital Advisors, we believe this heightened volatility is likely to represent the return pattern for investors for the foreseeable future. As such we believe it is important for investors to incorporate a high quality portfolio for their core equity investments. Additionally, making use of so called alternative investments that potentially minimizes downside returns is equally important.


Friday, February 10, 2012

Pick Your Strategist/Advisor Carefully

The below chart was provided by the Wall Street Journal courtesy of Doug Kass.

rosenberg roubini sp chart


Wednesday, February 08, 2012

Congress Desires To Eliminate Tax Deferral Option Of Inherited IRAs

In Congress' effort to continue transportation funding, Senate Finance Chairman Max Baucus (D., Mont.) has recommended the bill include a provision limiting the tax deferral options of inherited IRAs unless the IRAs have been converted to a Roth. In simple terms, currently, inherited IRA beneficiaries are able to withdrawal funds over the beneficiary's life expectancy. Beginning in 2013, the proposed legislation would require most non-spouse inheritors of traditional IRAs to withdraw the entire amount from a traditional IRA within five years. There are a few exceptions that are detailed in a recent Forbes article, Congress May Crush Key Tool For IRA Inheritors. The Forbes article notes, "Let’s hope there’s enough of a public outcry that this legislation doesn’t pass. If it does, owners of traditional IRAs will have one more reason to convert them to Roth accounts. The mark up legislation can be viewed at this link (PDF).


Tuesday, February 07, 2012

January A Risk On Month

As we noted in our fourth quarter investor letter, the new phrase repeated throughout 2011 was “risk on/risk off,” simply defined as buying riskier investments during positive market moves and selling riskier investments during downward moving equity markets. “Risk on” assets include stocks, commodities and high-yield bonds; whereas “risk off” assets include cash, U.S. treasuries and gold. Specifically, in a "risk on" environment, stocks that have higher betas tend to be favored by investors. Higher quality dividend paying stocks tend to move out of favor during these "risk on" phases relative to the higher beta investments.

January was certainly a case in point where "risk on" was the operative strategy. In January the average return for dividend payers in the S&P 500 Index trailed the non payers by 3.30 percentage points.

payers vs non payers 1 2012


Sunday, February 05, 2012

Presidential Election Year Stock Market Return

More times than not, in a presidential election year the stock market has had better performance when the incumbent party wins. As noted in a recent T. Rowe Price report, "the S&P 500 Index has risen in 12 of the 16 election years since World War II. While that’s about the same percentage of all up years in that time, the index had an average gain of 9.2% when the incumbent party won and just 2.2% when it lost, according to Ned Davis Research." The report also notes that the market has declined in two of the last three presidential election years.

From The Blog of HORAN Capital Advisors

Source:

The Stock Market In Presidential Election Years (page 7)
T. Rowe Price Report
Winter 2012
http://individual.troweprice.com/public/Retail/xStaticFiles/Winter2012PriceReport.pdf


Saturday, February 04, 2012

Milton Friedman On Capitalism 32 Years Ago

A two minute excerpt from a 1979 Phil Donahue show where Milton Friedman talks about capitalism and socialism.


Friday, February 03, 2012

Labor Market Only Marginally Better

Although the equity market liked the employment report this morning, the labor market is far from where it needs to be to absorb the jobs lost since the last recession. The 243,000 jobs that were added was the highest in the last nine months; however, the number of employed is far below the level prior to the recession--5.6 million below.

From The Blog of HORAN Capital Advisors

Certainly the addition of 200,000+ new jobs is a positive, but this recovery remains one of the weaker recoveries in terms of job creation. The participation rate remains at a level last reached more than 20 years ago. The employment to population ratio and the average duration of unemployment also remain at problematic levels.

From The Blog of HORAN Capital Advisors


Sunday, January 29, 2012

Stock Buybacks Do Not Benefit Future Stock Performance

In a recent research report by Thomson Reuters they note that a company's stock buyback activity generally does not add value subsequent to the buyback. A reason cited is the fact companies generally have more cash on hand in good economic environments and this tends to be after the stock price has already reflected a more positive operating environment. The report concluded:
"...most companies in the S&P 500 index have not been successful in adding value through stock buybacks in the time frames we observed. The positive correlation between buyback activity and price suggests a combination of poor market timing as well as policies that increase repurchases when firms have more free cash flow. This may be partially explained by the need for officers of public companies to make some use of the cash on hand, including keeping less of it due to the possibility of being taken over. The negative correlation between repurchases and forward returns shows that most buybacks did not pay off within the year after purchase."
Even for the market (S&P 500 Index) overall, the increased buyback activity occurs at ever increasing price levels.

From The Blog of HORAN Capital Advisors

One interesting aspect of the buyback activity at this point in time is it does seem to be at a sufficient level that it makes up for the lack of investor fund flows into equity mutual funds. As the below chart notes, cumulative outflows in equity mutual funds is running at a little over $400 billion dollars since 2006. Buybacks over that same time period total approximately $2.1 trillion through the 3rd quarter of 2011 as reported by Standard & Poor's (PDF).

From The Blog of HORAN Capital Advisors

A few companies were highlighted in the Thomson report as having timed their buybacks successfully. One example is St. Jude Medical (STJ). As the below chart shows, the company tended to successfully execute its buyback on dips in the company's stock price.

From The Blog of HORAN Capital Advisors


On the other hand, Exxon Mobil's (XOM) buyback timing seems to occur after the company's stock price has rallied.

From The Blog of HORAN Capital Advisors

For investors then, buybacks tend not to be a good predictor of future stock price performance. We have written several posts in the past about some of the pitfalls in company stock buyback programs. Ideally, investors should focus on a company's dividend practices. When a company increases its dividend, it is making a long term commitment of its future cash flow; hence, a more significant statement about future earnings prospects.

Disclosure: Long XOM and no position in STJ


Friday, January 27, 2012

Fourth Quarter 2011 Investor Letter

Fortunately for investors, the calendar has turned to a new year and 2012 has gotten off to a strong start in January. As our 4th Quarter Investor Letter notes, 2011 was a flat but volatile year for the market (S&P 500 Index); however, as of 12/31/2011, the 3-year annualized return for the S&P is 14%. Not bad for a 3-year time period. The disparity in valuations between stocks and bonds is near record levels as we discuss in our Investor Letter.

The Letter can be accessed directly from our website at the following link: 4th Quarter 2011 Investor Letter

We hope you find the content of our letter insightful as we look to 2012.


Sunday, January 15, 2012

High Ratio Of Public Debt To GDP Constrains Economic Growth

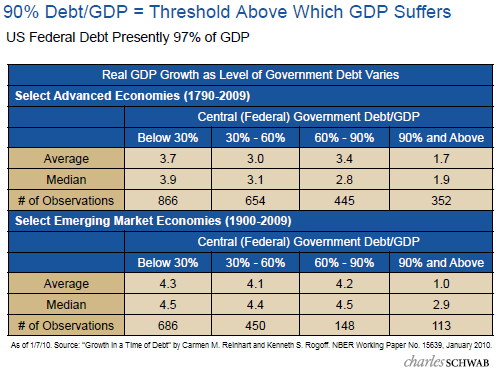
Approximately two years ago Carmen M. Reinhart and Kenneth S. Rogoff completed a comprehensive study, “Growth in a Time of Debt”, which looked at public debt levels around the globe and the resultant impact on economic growth for the respective economies. The study noted the historical consequences of various debt levels relative to an economy's GDP growth with the impact of increasing public debt levels on a country's economy being different for emerging and developed economies. The study authors concluded economic growth does tend to suffer significantly when a country's debt to GDP level exceeds 90%. For some emerging economies, debt to GDP levels over 70% begin to constrain growth. In the U.S. public debt to GDP is now over 90%.

From The Blog of HORAN Capital Advisors

Reinhart and Rogoff noted in their study:
"The simplest connection between public debt and growth is suggested by Robert Barro (1979). Assuming taxes ultimately need to be raised to achieve debt sustainability, the distortionary impact imply is likely to lower potential output. Of course, governments can also tighten by reducing spending, which can also be contractionary. As for inflation, an obvious connection stems from the fact that unanticipated high inflation can reduce the real cost of servicing the debt. Of course, the efficacy of the inflation channel is quite sensitive to the maturity structure of the debt. Whereas long-term nominal government debt is extremely vulnerable to inflation, short term debt is far less so. Any government that attempts to inflate away the real value of short term debt will soon find itself paying much higher interest rates...

...In principle, the manner in which debt builds up can be important. For example, war debts are arguably less problematic for future growth and inflation than large debts that are accumulated in peace time. Postwar growth tends to be high as war-time allocation of manpower and resources funnels to the civilian economy. Moreover, high war-time government spending, typically the cause of the debt buildup, comes to a natural close as peace returns. In contrast, a peacetime debt explosion often reflects unstable underlying political economy dynamics that can persist for very long periods."
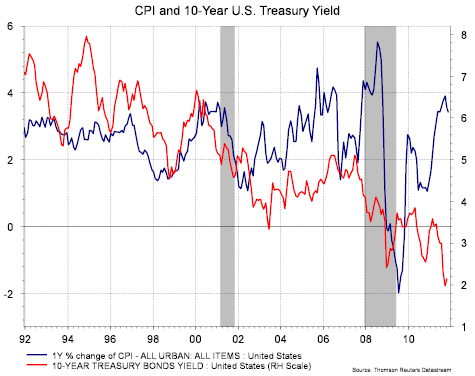
Finally, as the below chart shows, debt levels in Europe (emerging and developed) and the U.S., have seen significant growth since just 2003.

From The Blog of HORAN Capital Advisors

An important outcome of these higher debt levels will be how each country decides to reduce its dependence on debt (balance governmental budgets), while at the same time not implementing policies that constrain private sector growth.


The Dangers Of Leveraged ETFs

From time to time questions arise about using leveraged ETFs in one's portfolio strategy. We caution longer term oriented investors to not use these type of ETF investments. For example, if an investor believes the market will rise in the near term, why not consider a two or three times ultra bull ETF. In this case an investor would expect the ETF to generated two or three times the return of the underlying index. Well, for an investor, it is not that simply due to how the math calculation works. Let's look a 2x's ultra long or bullish ETF example.
  • Lets assume at the beginning of day 1 an index is trading at $100. At the end of the day the index closes at $90 or down 10%. The leveraged ETF would close at $80 or down 20%.
  • On day 2 the index rises to $99 or up 10%. The 2x's leveraged ETF would increase to $96, that is $80 * 1.20=$96.
  • Over the two day period though the index is down 1% while the leverage ETF is actually down 4% or four times worse than the index return versus the expected two times worse return.
From The Blog of HORAN Capital Advisors

One problem with many of these leverage ETFs is they reset daily and individual investors generally do not rebalance their portfolios on a daily basis. So as one can see, the performance of these ETFs over a period longer than one day can differ significantly from their stated daily performance objectives. More on this topic can be found on the SEC's web site in an article they wrote titled, Leveraged and Inverse ETFs: Specialized Products with Extra Risks for Buy-and-Hold Investors.


Saturday, January 07, 2012

Forecast For 2012 By Ed Hyman And Bob Doll

The recent WealthTrack interview conducted by Consuelo Mack features Ed Hyman, Chairman and Founder of ISI Group, and Bob Doll of BlackRock. Ed Hyman has been rated the #1 economist by Institutional Investor for 32 years running. Both strategist see the U.S. as the best house in a bad neighborhood for investors. Hyman notes the US economic data has been better, but not great, every week for the past three months. For more on their insights for 2012, readers can view the below video.


Monday, January 02, 2012

Equity Risk Premium Near An Extreme

The equity risk premium recently reached levels last seen at the height of the financial crisis in 2008. The high risk premium level suggests equities are attractive at this point in the market cycle. One key is whether corporate earnings can continue to make new record highs in 2012. Earnings growth is expected albeit at a slower rate than achieved in 2011. Given the level of stock buybacks and more importantly, company dividend increases, it seems equities could do well looking forward. The buyback and dividend actions by companies provide some level of favorable insight into company earnings expectations. As is typically the case, unforeseen events can derail a favorable market environment. The known risks are numerous and will continue to result in somewhat volatile price action (sovereign debt issues, political rhetoric in the U.S., dealing with the U.S. budget deficit and debt levels, just to name a few), but our forecast suggests equity prices should end 2012 higher.

From The Blog of HORAN Capital Advisors


Sunday, January 01, 2012

Dogs Of The Dow For 2012

The Dogs of the Dow in 2011 significantly outperformed the Dow Jones Industrial Average Index (DJIA) and the S&P 500 Index on a price only basis in 2011. The Dow Dogs returned 12.2% versus the DJIA return of 5.5%. The S&P 500 Index was essentially flat on the year.

The Dow Dog strategy consists of selecting the ten stocks that have the highest dividend yield from the stocks in the Dow Jones Industrial Index (DJIA) after the close of business on the last trading day of the year. Once the ten stocks are determined, an investor would invest an equal dollar amount in each of the ten stocks and hold them for a year. The strategy has generated mixed results over the years.

The Dogs of the Dow for 2012 have two new additions, Procter & Gamble (PG) and Kraft (KFT). The two stocks eliminated from the Dow Dogs are Chevron (CVX) and McDonald's (MCD). Below is a list of the Dogs of the Dow for 2012.


Saturday, December 31, 2011

Moderate Inflation Benefits Equities

During moderate periods of inflation, equities tend to generate decent performance results. I posted the below chart in a post, Where To Invest In An Inflationary Environment, in mid 2010 that details the performance of various investment categories based on different inflation ranges going back to 1972.

From The Blog of HORAN Capital Advisors

Since mid year 2010 inflation has been trending higher with the latest year over year report showing inflation running at nearly 3.5%.
From The Blog of HORAN Capital Advisors

The blog at Crossing Wall Street selected the below chart as the Overlooked Chart of the Year. The chart compares the S&P 500 Index to the market’s expectation for inflation (the 10-year TIP spread). Of late, there has certainly been a high correlation to higher inflation expectations and the S&P 500 Index return.

From The Blog of HORAN Capital Advisors

Determining the true level of inflation is also a frequent topic. The Shadow Government Statistics (SGS) site makes an effort to track data on indexes when the calculation methodology is changed. In 1990, the CPI calculation was changed and a comparison of the current CPI versus the 1990-based calculation can be found on the SGS site.


Friday, December 30, 2011

Equity Performance in 2011

With the close of trading today, following is a quick look at the 2011 price performance of a few select equity markets around the globe.

From The Blog of HORAN Capital Advisors
Source: Reuters


Monday, December 26, 2011

Watching The Valuation Of Dividend Payers

The investment mantra this year has been to focus on dividend paying stocks. Over the long run, payers have had a tendency to outperform the non payers and this has certainly been the case this year. On the other hand though, valuations do matter and the below chart provides investors with a cautionary view of simply buying "any" investment that has yield.

From The Blog of HORAN Capital Advisors


Saturday, December 17, 2011

Investors Favoring Bond Funds

Recent mutual fund flow data shows investors continue to favor bonds over equities.

From The Blog of HORAN Capital Advisors
Source: ICI
With the sovereign debt issues in Europe top of mind for investors, they continue to bet the best of the worst fixed income investments are U.S. Treasuries. One risk investors face with fixed income investments is the negative impact of a rise in rates. The 10-year U.S. Treasury yield is a meager 1.85% in spite of the fact the consumer price index is running at a year over year rate of 3.4%. Investors are in for a rude awakening when rates do begin to move higher (bond prices have an inverse relationship to the move in interest rates).

From The Blog of HORAN Capital Advisors


Thursday, December 15, 2011

Fragile Employment Market

The improvement in the unemployment rate earlier this month was certainly positive on the surface. The rate declined to 8.6% from the previously reported 9%. The improvement though came largely from the 300,000 individuals that simply stopped looking for a job. As a result, these additional people are not counted among the unemployed. As the below chart shows, the number individuals not in the labor continues to rise.

From The Blog of HORAN Capital Advisors

This fragile state of the consumer also shows up in the number of individuals on food stamps.

From The Blog of HORAN Capital Advisors