Sunday, December 31, 2017

Most Read Articles From Our Blog In 2017

Below is a list of the most read blog articles in each month during 2017. One interesting commonality for some of the top posts is the fact the ones focusing on investor sentiment tend to gain higher levels of readership. Sentiment is one important market factor we monitor on a fairly regular basis. Secondly, some prior articles seem to remain applicable as 2018 is set to begin. For example, articles like Market Pullbacks Should Be Expected and The S&P 500 Index Is Expensive and Has Been So Since The Early 1990's are certainly timely even today.

Our firm's bullish equity stance in 2016 and 2017 has certainly rewarded our clients. We are in the midst of finalizing our Winter Investor Letter which will contain some of our firm's thoughts on the coming year.

To our clients and readers, we wish all of you a Healthy and Prosperous New Year.

Second Longest S&P 500 Rally Since 1932 - January 25, 2017

Recent Outperformance Of Low Volatility A Sign Of Risk Off Ahead?
- February 12, 2017

Time To Reduce One's Equity Exposure? - March 1, 2017

Widespread Bearishness Indicating Market Nearing A Turning Point? - April 14, 2017

The Unfortunate Rise Of The Misleading 'Scary Chart' Comparisons Again
- May 29, 2017

Market Pullbacks Should Be Expected
- June 26, 2017

Strong Earnings Growth And Favorable Valuations Lead To Weak Stock Returns - July 22, 2017

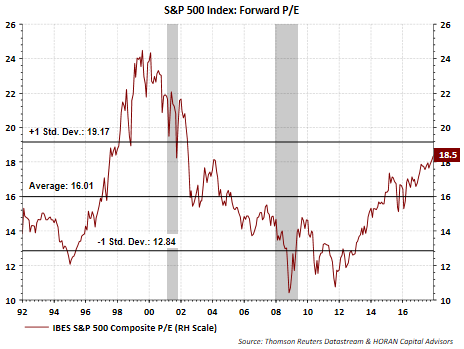
The S&P 500 Index Is Expensive And Has Mostly Been So Since The Early 1990's
- August 5, 2017

Stocks Need Some Healthy Competition - September 16, 2017

Citgroup Economic Surprise Indices Have Little Bearing On Equity Market Performance
- October 15, 2017

Individual And Investment Manager Sentiment Is Diverging - November 2, 2017

If Cash Is King - December 19, 2017


Thursday, December 28, 2017

Continued Improvement In Bullish Investor Sentiment

In the few weeks after the 2016 presidential election, individual investor bullish sentiment spiked to near 50%. Over the course of the next five months though, bullish sentiment trended lower to a year low of 23.85%. From March through April the market had some volatile periods that may have influenced investor sentiment; however, true to form this year, the market never experienced a prolonged or significant contraction.


Sunday, December 24, 2017

Dogs Of The Dow Make Up Ground In Second Half Of This Year

Four trading days left until the calendar turns to 2018 and one will be able to determine the list of stocks that will comprise the Dow Dogs of 2018. The Dow Dogs were laggards in the first half of the year, but have made up significant ground in the second half of 2017. To date the Dow Dogs of 2017 have outperformed the S&P 500 Index on a total return basis due to the Dogs higher dividend yield. However, the Dogs of the Dow have underperformed the Dow Jones Industrial Average Index on both a price only and total return basis. The best performing Dow stock that is not included in the Dow Dogs this year is Apple (AAPL) and the stock is up 51.1%.

The Dogs of the Dow strategy is one where investors select the ten stocks that have the highest dividend yield from the stocks in the Dow Jones Industrial Index (DJIA) after the close of business on the last trading day of the year. Once the ten stocks are determined, an investor invests an equal dollar amount in each of the ten stocks and holds them for the entire next year. The popularity of the strategy is its singular focus on dividend yield.


As of Friday's close both Boeing (BA) and Caterpiullar (CAT) will drop out of the Dogs for 2018. The two holdings in the running for inclusion in next year's portfolio are Procter & Gamble (PG) and General Electric (GE) with dividend yields of 2.99% and 2.74%. respectively.


Thursday, December 21, 2017

Small Business Optimism And Equity Market Return One Year Later

When the NFIB Small Business Optimism reading for December 2016 was announced in January, the December reading jumped 7.4 points to 105.8. At that time the optimism reading was the fifth highest reading recorded by NFIB. Prior instances of strong optimism readings were followed by positive stock market returns in the subsequent twelve months. NFIB's Small Business Optimism report last week closed out the subsequent twelve month period from the December 2016 reading and the stock market did not disappoint. As the below chart shows, the S&P 500 Index was up over 18% from December 15, 2016. The market's return was the best performing one out of the other four top NFIB readings. 


As noted in an earlier post, last week's NFIB Small Business Optimism report has the index at its second highest level in its 44-year history.


I will begin tracking the market's performance over the next twelve months and will evaluate the return. If history rhymes at all, 2018 stock market returns would be positive.


Is Optimism Too High?

One of my more regular topics that I write about on the blog from time to time is an update on sentiment measures, both individual and business. Sentiment might be viewed as the third leg of a stool, with the other two being the economy and business financial health or earnings growth. Without positive sentiment from businesses and investors, the economy is more likely to see lackluster growth. What got me to thinking about whether optimism is too high or not was a recent post by Josh Brown whose blog is titled The Reformed Broker.


Tuesday, December 19, 2017

If Cash Is King

Much has been written about the stock market's advance since the end of the financial crisis in 2009. Without getting into the valuation issues, as I have written about that for maybe too many times, the recent return, nearly past two years, has been pretty remarkable and has occurred with a very low level of volatility.


Business and consumer optimism is high, institutional investor optimism is high and individual investor optimism is rising. Almost seems as good as it can get from a sentiment perspective. We know corporations are sitting on a lot of cash with large amounts trapped overseas. The tax bill working its way through Congress is addressing this issue via a change on the taxation of cash held outside the U.S. This increase in corporate cash seems to be an issue that has developed over many years as can be seen in the two charts below. The first chart notes the absolute dollar amount of the cash while the second chart shows corporate cash as a percentage of GDP.


With the passage of a tax reform package, undoubtedly, corporate cash will likely be used in a number of different ways. Recently, Factset reviewed how companies responded to the tax holiday in 2004. Factset's analysis notes:
"In 2003, a combined $30.3 billion in special dividends was paid to shareholders of S&P 500 constituents  this figure jumped to $179.4 billion in 2004, an increase of 492%. In 2005, aggregate special dividends fell to $49.2 billion. Of this $179.4 billion, a collective $149.8 billion (84%) came solely from companies in the GICS Information Technology sector. Notable companies such as Microsoft (MSFT-US) and Motorola (MSI-US) contributed the most to this total. Financials and Healthcare were also top contributors."
And finally, at the end of the day, there will likely be demand for stocks outside of just corporate buybacks. As the below chart shows, both in absolute terms and as a percentage of GDP, household deposits are far above pre-financial crisis levels. As a percentage, deposits are nearly 60% of GDP. If cash is king, individual investors are sitting on potential fuel for the next move higher in equities.


Disclosure: Long MSFT


Companies Begin Highlighting Earnings Benefit From Tax Reform

It seems a day does not go by where the market's valuation is a front and center topic of discussion. Suffice it to say that I believe, and have written as such recently, that the market does not correct simply because it may be trading at an elevated valuation. Although market declines or pullbacks have been few and far between, when the next pullback occurs, a factor in the the magnitude of the decline will likely center on the market's valuation.

The below chart shows the current market P/E where the earnings are based on the 12-month forward earnings estimate supplied by I/B/E/S. Certainly the P/E is elevated at near a +1 standard deviation level, still the current P/E is quite a bit lower than the technology bubble valuation peak of near 25 times earnings.


Overall earnings growth will be important for the equity market to generate respectable returns in 2018. With passage of a tax reform package nearing realization, companies will benefit from the decline in the maximum corporate tax rate. As an example, tonight FedEx (FDX) reported earnings and noted in the conference call that a lower tax rate will add $.85 to $1.00 to per share earnings. This represents an earnings boost of 8% based on currently expected May 2018 earnings of $12.45 per share. What the tax bill does for many companies is provide an earnings benefit that will result in a reset of the market's valuation to a lower level. The result is the market's valuation is closer to its long run average of 16 to 17 times earnings.

Disclosure: Long FDX


Thursday, December 14, 2017

A Spike Higher In Bullish Investor Sentiment

Today the American Association of Individual Investors reported results of their Sentiment Survey for the week ending 12/13/2017. The report shows individual investor bullish sentiment jumped 8.1 percentage points to 45.0%. 


Most of the jump in bullish sentiment was a result of a 6.1 percentage point decline in bearish sentiment. This has resulted in the bull/bear spread widening to 16.9%, the third widest spread in 2017.


As I have noted in prior sentiment updates, the survey results can be volatile and the 8 period moving average removes the weekly volatility. Additionally, the sentiment measures are contrarian ones and are most useful when they are at their extremes. The current report is not at an extreme level; however, it is elevated and worth paying attention to as the market continues to move higher and exhibit a low level of volatility.


Tuesday, December 12, 2017

A Continued Surge In Small Business And Consumer Optimism

Sentiment for both consumers and small businesses continues to soar. Today the NFIB Small Business Optimism Index was reported at 107.5. I highlighted the surge in consumer sentiment at the end of November.


NFIB notes in its report,
"Not since the roaring Reagan economy has small business optimism been as high as it was in November, according to the National Federation of Independent Business (NFIB) Index of Small Business Optimism, released today." 
“We haven’t seen this kind of optimism in 34 years, and we’ve seen it only once in the 44 years that NFIB has been conducting this research,” said NFIB President and CEO Juanita Duggan. “Small business owners are exuberant about the economy, and they are ready to lead the U.S. economy in a period of robust growth.”
The report also indicates the current reading for November is the second highest reading in the 44-year history of the Index. Some highlights in the report:
  • Job Creation plans increased six points last month, providing more evidence of a strong labor market.
  • The number of owners who said it’s a Good Time to Expand rose four points.
  • Inventory Plans increased by three points.
  • Inventory Satisfaction increased by three points and,
  • Actual Earnings Trend moved up two points.
The significant improvement in sentiment, especially in business sentiment, has been a common theme for the last year. NFIB's report on December 2016 small business optimism saw one of the Index's largest increases. Below is a chart tracking the market's performance since NFIB's last five highest readings from December of last year. This year's market return has been the strongest.


Sentiment is an important part of investing psychology. With both consumer and small business expressing high levels of optimism, it is not surprising equity returns have been as strong as they have been this year.


Sunday, December 10, 2017

Earnings, Not Multiple Expansion, The Key To Favorable 2018 Equity Returns

It seems like an eternity since the S&P 500 Index experienced a pullback of more than 5%. In fact, the last greater than 5% pullback occurred over a year ago during the period of June 8, 2016 to June 27, 2016. This lack of downside volatility has taken place during a nearly uninterrupted increase in the market that began in February last year. Additionally, the market advance since the end of the financial crisis looks remarkable as well. Little or no downside volatility might be understandable if the equity markets were trading sideways this entire time; however, that has not been the case as can be seen below.


Wednesday, November 29, 2017

Strong Corporate Profit Picture A Key Component In Today's GDP Report

Included with today's second estimate GDP report by the Bureau of Economic Analysis is the preliminary estimate for third quarter corporate profits. The corporate profit measure is reported in several different formats, i.e. with and without inventory valuation and capital consumption adjustments. As I noted in a June post, more information on the adjustments can be found can be found in this BEA Briefing Paper (PDF).

The profit growth before tax and with the inventory valuation and capital consumption adjustments equaled 5.4% on a year over year basis. Without the adjustments, year over year profit growth equaled 10%. Importantly, NIPA profits have a nearly 1.0 correlation to IBES S&P 500 forward earnings and historically peak four quarters, or a year before the IBES forward earnings estimate. This preliminary corporate profit report is not signalling a peak in IBES S&P 500 forward earnings.


Also, with the preliminary corporate profit growth figure one can evaluate the NIPA P/E. The growth in NIPA corporate profits has resulted in a slight decline in the NIPA P/E as can be seen in the below chart. As I noted in the June post referenced above, what is useful with the NIPA profit measure is the fact it covers a larger earnings base for the U.S and covers more industries as it is not limited to public companies. Additionally, the NIPA figure makes an effort to adjust for the differing accounting measures being utilized by companies.


By reviewing some of my posts written over the past few months, the lack of any meaningful market pullback has been one recurring theme. However, with the continued strength exhibited in corporate profit growth, the market's path is certainly warranted as stock prices follow earnings. Also, the strong profit picture is beginning to result in a downtrend in the market's NIPA valuation, without a significant correction taking place. That does not mean high valuation equities will not correct more significantly, like what occurred in some technology stocks today. All in all, today's revision higher in Q3 GDP and the prelimnary profit report are both tailwinds for the economy and equity markets, all else being equal.


Tuesday, November 28, 2017

Soaring Consumer Confidence

Consumer confidence soared to a 17-year high in The Conference Board's report today. High levels of consumer confidence tend to translate to an improved retail sales environment as can be seen in the below chart. With consumers accounting for approximately 70% of economic (GDP) activity, today's confidence report portends a positive retail sales environment during the holiday shopping season.


On the other side of the coin though, The Conference Board's third quarter CEO Confidence measure was reported with a slight decline in early October as represented by the green line in the below chart. About two weeks ago we reported on the NFIB Small Business Optimism measure and it declined as well in its recent report; however, small business optimism remains at a high level.


Overall, confidence levels for business and consumers are at relatively high levels and this should be a tailwind for economic activity near term.


Sunday, November 26, 2017

The Sentiment Cycle Phase: "Buy The Dip"

Aside from fundamental market data, the equity market tends to follow a sentiment cycle as described by Justin Mamis, a famed market technician and author, who wrote several books on technical analysis. One of his books, The Nature of Risk, contains a discussion on the equity market's sentiment cycle. Below is The Sentiment Cycle chart included in The Nature of Risk.


In The Nature of Risk Mamis notes the market sentiment cycle begins with stocks climbing the proverbial "wall of worry." In a post I wrote in July 2009, Where Are We In The Market Cycle?, I noted the market seemed to be coming out of the financial crisis and had moved into this "wall of worry" phase of the sentiment cycle. Then in June of 2014 I noted in a blog post, VIX Is Low But Investors In Denial Stage Of Market Sentiment Cycle, I surmised the market was likely in the "denial" phase of the sentiment cycle. Today, I believe we are in or near the "buy the dip" phase of the market sentiment cycle.


One missing aspect with the market today is the lack of slowly increasing trading volume like occurred in the run up to the market top in 2008 and seen in the above monthly market chart. However, the lack of any significant market pullback since mid year 2016 is certainly representative of investors being content with "buying on the dips."

The sentiment cycle length seems to be an extended one in this bull market cycle and we can list any number of reasons for the extension. However, from a sentiment and technical perspective, this cycle, although long in duration, likely has further upside as buying "enthusiasm" seems absent. A confirming enthusiasm data point would be increasing volume into a so called blow off top.

Lastly, in Justin Mamis' last newsletter, he highlighted The Sentiment Cycle chart and had the following to say about it:
A cycle begins with stocks climbing “a wall of worry,” and ends when there is no worry anymore. Even after the rise tops out, investors continue to believe that they should buy the dips...Unwillingness to believe in that change marks the first phase down: “It’s just another buying opportunity.” The second, realistic, phase down is the passage from bullish to bearish sentiment...Selling begins to make sense. It culminates with the third phase: investors, in disgust,...dump right near the eventual low in the conviction that the bad news is never going to stop…
I think investors would have a hard time arguing against the fact that "buy the dip" is prevalent in recent stock market action. 


Saturday, November 25, 2017

Answering Market Questions Over Thanksgiving

In addition to receiving a few questions about Bitcoin from a few relatives over Thanksgiving, the other common question/comment was "can you believe this stock market, how long can it last." I confess I do not believe in market timing nor do I have a crystal ball; however, that does not mean one should put their head in the sand and ignore important market signals. Aside from the importance of monitoring weekly economic data reports, investors can review a couple of high level data points to gain perspective on the health of the economy and companies broadly. Just as earnings growth is important to evaluate at the company level, market level earnings are important as a rising tide may be lifting all boats. There is truth to the fact that stock prices have a tendency to follow earnings and that is clearly evident in the below chart.


Sunday, November 19, 2017

NFIB Small Business Optimism Index Highlights Tight Labor Market

Last week NFIB's October report on Small Business Optimism fell short of expectations, but remained at a high level at 103.8 versus 103 in the prior report. A few highlights from the report:
  • "The tight labor market got tighter for small business owners last month, continuing a year-long trend. Fifty-nine percent of owners said they tried to hire in October, with 88 percent of them reporting no or few qualified applicants."
  • "Consumer sentiment surged based on optimism about jobs and incomes, an encouraging development as consumers account for 70 percent of GDP," said NFIB Chief Economist Bill Dunkelberg.

And continuing to track the market's performance from December of last year (January's report) when NFIB reported one of the highest NFIB readings, the current S&P 500 Index return is outpacing prior market returns associated with high NFIB readings as seen in the below chart.


With a surge in consumer sentiment and a small business environment that is showing continued strength in hiring, these two factors alone should serve as a tailwind for the economy and market in the months ahead.


Saturday, November 18, 2017

Are Bearish Investor Sentiment Responses Translating Into Actual Action?

The S&P 500 Index is only down .60% from its November 8, 2017 high yet individual investor and institutional equity sentiment has turned significantly less positive. This negative sentiment has not translated into broadly lower equity prices though, but knowing sentiment measures are contrary indicators, they are approaching levels that would be suggestive of higher equity prices ahead.


Sunday, November 12, 2017

Equity Corrections Will Occur Again, Maybe Sooner Than One Expects

If there is one factor that perplexes me about the current market environment it is the lack of volatility since the election. The last time the market experienced a greater than 5% correction was in June of 2016 and the last double digit pullback was in February 2016. Going back to 1980 the average intra-year market decline for the S&P 500 Index is 14.1%. I have written a number of recent posts on the positive global economic environment, at the risk of sounding like a broken record, that may be serving as a tailwind for equity market returns around the world.

On the surface, if one knew mutual funds were holding elevated cash positions, they might conclude that this is a bullish data point since the cash can be deployed in additional equity investments. On the other hand, elevated liquidity in equity funds may be a sign of investors rapidly allocating more funds to equities and this might actually be a negative sentiment measure. In fact, as the below chart shows, there is a high correlation to elevated liquidity in equity funds and market tops.


Friday, November 10, 2017

If History Repeating; Another Five Years For Equity Bull Market

Shortly after the 2016 election in a post titled, Equity Market Beginning To Resemble Bull Market Of The 1950's And 1980's, I discussed how the equity market continued to trace a similar path as the market in the those two earlier decades. A part of my conclusion indicated the anticipated policies under a Trump administration would resemble policies implemented in the 1950's and 1980's, like tax reform and infrastructure spending. Reality is setting in and not much seems to be getting done in Washington on those two fronts; however, the current market continues to follow a similar path as in the 50's and 80's. Better sentiment and regulatory reform, even though by executive order, seems to be having a positive influence on companies. If the past is any guide then, the bull market might have at least another five years to run as can be seen in the below chart.


Thursday, November 09, 2017

Biases Influence Investment Decisions

Every investor makes investment decisions that are influenced by ones biases that form over time. These biases may come in many forms but they tend to fall into a couple of categories, emotional or cognitive. I mention this because it is not that uncommon that I sit down to write a blog post on a certain topic thinking the post's conclusion will go in one direction, but end up with a different conclusion after evaluating some of the research. Some of these blog topics are developed by flipping through a lot of charts, which I do frequently. One such chart is below and shows the relative performance of the S&P 500 Dividend Aristocrats to the S&P 500 Index.


Monday, November 06, 2017

Investment Opportunities Outside The U.S.

In a post yesterday I somewhat rhetorically titled the post wondering if the equity market was at a top. In short, I do not know, but offered suggestions for investors about reviewing their asset allocation vis-à-vis their spending needs.

Not all markets have traveled the same path as the S&P 500 Index though. A number of markets outside the U.S have lagged the U.S. since the end of the financial crisis. The below chart compares the cumulative performance of the S&P 500 Index (SPY) versus the MSCI ACWI ex U.S Index (ACWX). The chart goes back to the beginning of 1992 and clearly the S&P 500 has a performance advantage with a widening gap beginning to develop around 2011.