Sunday, August 28, 2011

Weaker Consumer Confidence/Sentiment A Headwind

The sentiment readings released so far this month continue to be reported at levels weaker than those associated with stronger economic growth. The IBD/TIPP Economic Optimism Index is reported near the beginning of each month. In August, the TIPP Economic Optimism Index declined by 5.6 percentage points to a historic low of 35.8 vs. 41.4 in July. The index is 8.6 points below its reading of 44.4 in December 2007 when the economy entered into its last recession. Index readings above 50 indicate optimism; below 50 indicate pessimism. The TIPP Index does a fairly decent job forecasting other sentiment reports released later in the month.

From The Blog of HORAN Capital Advisors

The TIPP Index is comprised of three components, all of which declined in August:
  • The Six-Month Economic Outlook: a measure of how consumers feel about the economy’s prospects in the next six months.
  • The Personal Financial Outlook: a measure of how Americans feel about their own finances in the next six months.
  • Confidence in Federal Economic Policies: a proprietary IBD/TIPP measure of views on how government economic policies are working.
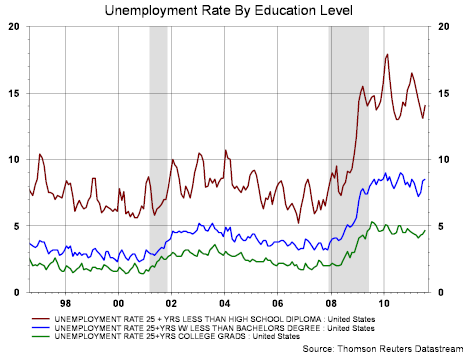
Of the 921 adults/households surveyed nationally this month, 29% of households say that at least one member of the household is looking for a full-time job. The economic policies to date have certainly not created jobs.

From The Blog of HORAN Capital Advisors

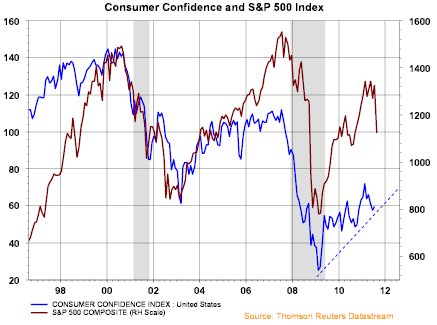
The consumer sentiment index released this past Friday was reported at 55.7 which was below expectations of 56, but, higher than the 54.9 reported in July. Tuesday the Conference Board releases its consumer confidence index. Consensus expectations are for the confidence report to come in at 52%. These levels are very depressed and far from an 80% reading that would be consistent with strong economic conditions. The importance of these sentiment and confidence figures is their correlation to consumer spending and more specifically retail sales.

From The Blog of HORAN Capital Advisors
Source: Barron's

Historically consumers have accounted for 70% of GDP and this deleveraging cycle is certainly influencing the consumer.


Sunday, August 21, 2011

Equity Put/Call Ratio Above 1.0 Again

Once again the equity put/call ratio moved above 1.0 at the close on Friday, reaching 1.04. The equity P/C ratio tends to measure the sentiment of the individual investor by dividing put volume by call volume. At the extremes, this particular measure is a contrarian one; hence, P/C ratios above 1.0 signal overly bearish sentiment from the individual investor. This indicator's average over the last 5-years is approximately .7, indicating the individual investor has been generally mostly bullish and more active on the call volume side.

From The Blog of HORAN Capital Advisors

For the institutional investor, technical analyst generally consider the index put/call ratio as a reflection of institutional sentiment. The index P/C ratio is slightly elevated at 1.53 and above its 5-year average of 1.4; however, in August 2007, the index P/C ratio stood at 2.7. Some would consider the current level of the index P/C as neither a bearish or bullish market sign at this time.

At HORAN, we believe business fundamentals are contrasting with equity market actions. This divergence is being driven in large part by the lack of confidence in Europe in dealing with its sovereign debt issues and in Washington's inability to deal with its budget deficit. Additionally, the amount of regulatory uncertainty that includes health care reform and potential income tax reform is a factor in business' ability to commit to longer term expansion plans. All of this also weighs negatively on consumer confidence and sentiment as well.

As the below chart shows, consumer confidence remains in an uptrend since early 2009; however, since February 2011 the confidence trend has been declining.

From The Blog of HORAN Capital Advisors

Lastly, there are some positive economic data points.
  • Industrial production in July was reported at .9% versus expectations of .5%. May and June industrial production were revised higher as well.
  • Leading economic indicators index increased .5% versus expectations of a .2% increase.
  • The Conference Board's coincident economic index (CEI) increased .3% with all four of its components increasing. Industrial production is a component of the CEI.
From The Blog of HORAN Capital Advisors
It is difficult to predict the markets in the short term, but technicals are starting to point to an oversold level as noted in this chart link and fundamentals, corporate and economic, are not decidedly negative. It seems to portend a slow economic growth environment with a focus on deleveraging around the globe.


Friday, August 19, 2011

Philly Fed Report Not A Good Predictor Of Future Stock Market Action

Analyst are extrapolating the weak report for the Philadelphia Fed Outlook on Thursday as a precursor to more stock market weakness. In actuality though, the monthly performance of the S&P 500 Index has a very low correlation to the monthly Philly Fed report. The below chart shows the data from August 2007 through August 2011. The "red" plot point is the August 2011 data.

From The Blog of HORAN Capital Advisors

As the above chart shows, the monthly Philly Fed report and the monthly return for the S&P 500 Index have a low correlation of .356. Additionally, the R-squared is only .127. The t-statistic is very low as well. The flatness of the best fit line is some indication that the market's performance is not very dependent on the monthly Philly Fed data.

In looking at the one year return for the S&P 500 regressed against the one month Philly Fed data does show a higher correlation, .791 and a higher R-squared of .626. If I compare the data back to 1996, the correlation and R-squared are slightly lower than that show in the below chart. Additionally, the one month S&P return versus monthly Philly Fed report has a very low correlation and low R-squared.

From The Blog of HORAN Capital Advisors
In a vacuum and in the short term then, this one Fed report is not a good predictor of future market returns. Certainly, the Fed report deserves investor attention; however, this data needs to be balanced against other fundamental company data and other economic data. We do believe the risk of a recession has risen, maybe 50-50 now versus one in three several weeks ago. Issues in Europe and lack of leadership in Washington in dealing with budget and economic issues is weighing negatively on consumer and business sentiment. This negative influence on sentiment can negatively impact future economic activity.


Monday, August 08, 2011

Certainly Short Term Oversold After Today

After today's market downdraft, the market is certainly oversold on a short term basis. The percentage of stocks trading above their 50 day moving average is now at the same level reached in late 2008, i.e., .40%. The caveat is, historically, the market has had a tendency to trade lower on a prospective basis after these low moving average percentage levels are reached.

From The Blog of HORAN Capital Advisors

Additionally, for those that are superstitious, the S&P 500 Index feel 6.66% today and reached a low of 666 in March 2009. Could it be at least a short term bottom?

From The Blog of HORAN Capital Advisors

A key question will be the impact the recent market action has on consumer and business sentiment. Additionally, if Congress and the administration in Washington would simply stop pointing fingers at S&P and admit and address the budget problem, i.e., reduce federal expenses, the market could find firmer footing. Now the increased risk is the negative impact on sentiment and is the potential impact on sentiment enough to tip the economy into a recession. Lastly, Europe has problems that could ripple through the global economy as well.


Sunday, August 07, 2011

U.S. Government Spending Versus Revenue As % Of GDP

As S&P noted in their downgrade of the U.S. government's credit rating, the rate of growth in the U.S.'s spending is a significant reason for the downgrade.

From The Blog of HORAN Capital Advisors


Saturday, August 06, 2011

Government Regulations Fueling Business Uncertainty

Talk to any owner of a business and they will tell you one of the major issues that inhibits the company's ability to grow is not only the level of regulations, but the proliferation of ongoing new regulations.

A recent report by the Heritage Foundation notes,
  • The spring 2011 Unified Agenda (also known as the Semiannual Regulatory Agenda) lists 2,785 rules (proposed and final) in the pipeline (emphasis added).
  • Of those, 144 were classified as “economically significant.” With each of the 144 pending major rules expected to cost at least $100 million annually, they represent at least $14 billion in new burdens each year.
From The Blog of HORAN Capital Advisors

Another negative impact of increased regulations is it swells the growth of government.
  • ...regulatory staff at federal agencies (full-time equivalents) increased about 3 percent between 2009 and 2010, from 262,241 to 271,235, and is estimated to rise another 4 percent—to 281,832—in 2011.
  • Federal outlays for developing and enforcing regulations are also expected to grow by 4 percent this year, from $46.9 billion in 2010 (in constant 2005 dollars) to $48.9 billion.
Reducing the regulatory burden would be one way Congress and the administration in Washington could relieve some of the uncertainty facing companies in the private sector. Additionally, reducing the growth of regulations would stem the growth of government.

Source:

Red Tape Rising: A 2011 Mid-Year Report

The Heritage Foundation
By: James Gattuso and Diane Katz
July 25, 2011
http://www.heritage.org/research/reports/2011/07/red-tape-rising-a-2011-mid-year-report


Friday, August 05, 2011

U.S. Credit Rating Downgraded From AAA to AA+

For the first time in history, the U.S.'s credit rating was lowered by Standard & Poor's from AAA to AA+. S&P’s action is the most tangible vote of disapproval so far by Wall Street on the deal between President Obama and Congress to cut the deficit by at least $2.1 trillion over 10 years. S&P has said that it wanted at least $4 trillion of deficit reduction. S&P noted the recent debt ceiling hike did not adequately deal with the underlining deficit issues. The federal budget is at a point where Congress and the administration must deal with the growth in the budget's long term annual deficits.

The full S&P downgrade report can be read here.


Uncertainty: A Correction But Not 2008/2009

This morning we sent out a client note covering the recent market action in light of the market's volatility. Much of the recent discussion has centered around the U.S. economy falling into a “double dip” recession. A recent JP Morgan strategy comment to investors noted the following:
“Historically, US recessions were about over expansion (consumer or business) followed by a contraction of liquidity-businesses/consumers have strong balance sheets and while the US bank system is extremely well capitalized today, it is hard to imagine the right impulse exists to create a recession.”
Our market comment titled, Uncertainty: A Correction but not 2008/2009, can be read by clicking the comment title link.

If we can answer any additional questions, please do not hesitate to call on us.


Tuesday, August 02, 2011

Market Short Term Oversold

Today's market sell off has the S&P 500 Index down for seven days in a row. The S&P index has declined 6.8% in this seven day period. A result of this decline is the number of stocks trading above their 50 day moving average has declined to 14%, a level at which the market has rebounded historically.

From The Blog of HORAN Capital Advisors

As we noted in our prior comments and second quarter newsletter, the market does seem stuck in a trading range. Today's decline puts the S&P at the bottom of the range that began in late February of this year. Additionally, the market could be in the process of making a double bottom, if not a triple one.

From The Blog of HORAN Capital Advisors

Lastly, several of the recent economic data points have come in on the weaker side. Confidence has been negatively impacted by the actions in Washington over the last several weeks; however, we believe the weaker manufacturing data points are partly related to the supply disruptions due to the tsunami in Japan. In short, we do not see a strong economic recovery from this point, but we do not see a double dip recession either. We believe the economy is stuck in a slow growth environment, which may not improve until business uncertainty is lessened.


Wednesday, July 27, 2011

Congress Having Difficulty Cutting Spending In Debt Ceiling Debate

The debate over raising the debt ceiling is now focusing on an important issue the rating agencies have highlighted, i.e., the deficit itself and the level of the governments debt. The difficulty some members of Congress are having has to deal with the apparent lack of cuts in the early years of both Reid and Boehner's agreement. As an example, in the Boehner plan, the cuts are very little in 2012 and is very much back end loaded. The Reid plan is no better in reducing the deficit as well.

(click for larger image)
From The Blog of HORAN Capital Advisors

Paraphrasing from a recent article on Zero Hedge's website, the CBO’s scoring of the Boehner budget proposal comes to a deficit reduction of $851 billion from 2012-2021. However, this plan is heavily back end loaded and, on a net present value basis the reduction is only $50 billion. The current federal deficit is about $1.4 trillion this year and growing; hence, some members interest in Congress to focus on expenses. Every year that passes without addressing entitlements, the more painful the medicine might be.

It is becoming increasing likely the August 2nd deadline is not met. If that is the case, what is the impact on cash levels at the Treasury? It appears the Treasury has enough cash until 8/12 and could probably get to 8/15, an interest payment date. This is highlighted in a Reuters article this morning. The table assumes that the Treasury will be able to at least roll over maturing debt on August 4, 11 and 15. See below chart from Stone & McCarthy research.

From The Blog of HORAN Capital Advisors

Both plans are highly likely to lead to a lowering of the government's credit rating given the reduced focus on the deficit and debt level.


h/t: Zero Hedge


Monday, July 25, 2011

Foreign Holders Of U.S. Government Debt

Which countries are impacted the most in a debt default, assuming it does occur. Below is detail on the foreign holders of U.S. government debt. The trend in the debt holdings is available from the U.S. Treasury site.

From The Blog of HORAN Capital Advisors
Graphic Source/Link: Reuters


Saturday, July 23, 2011

Debt Ceiling Alone Is Not The Only Issue

Raising the debt ceiling itself is not the issue facing Congress and the U.S. government. As the below chart shows, Washington seems to do a good job issuing new debt up to the maximum limit each time the debt ceiling is increased.

From The Blog of HORAN Capital Advisors

The result of Congress' propensity to spend is the government's budgeted expenses now far outpace incoming revenues. In fact, the government now borrows 40 cents of every dollar it spends as noted in the below chart.

From The Blog of HORAN Capital Advisors

The stickiness of the unemployment rate is contributing to this gap in expenses versus revenue. The below chart shows the "income security" spending component of the government's budget has nearly doubled to $603 billion from $374 billion since the beginning of 2008. This increase in the "income security" portion of the budget is highly correlated with the unemployment rate. The "income security category" includes unemployment compensation, housing and food assistance.

From The Blog of HORAN Capital Advisors

Not many CEOs have commented on the impact Washington's policies are having on business decisions, primarily the desire by businesses to increase employment. However, during a recent Wynn Resorts investor meeting, Steve Wynn, CEO of Wynn Resorts (WYNN), noted the difficulty businesses are having navigating the new policies and regulations coming out of Washington. The audio of a portion of that meeting can be heard at this link: Wynn Investor Meeting audio.

From The Blog of HORAN Capital Advisors

If politicians in Washington would simply develop a credible plan that reduced spending and created an environment that was conducive to growing revenue over some reasonable time frame, say ten years, the business environment in the U.S. would likely improve.


Wednesday, July 20, 2011

Economy After The Debt Ceiling Debate Concludes

It is nearly impossible to turn to any business or news program where the lead story is anything but commentary on the debt ceiling debate going on in Congress. As we noted in our 2nd Quarter Investor Letter published on Monday, the real issue is not simply raising the debt ceiling, rather the growth in the debt itself.

As the below chart shows, Congress has the unique ability to increase the Federal debt (spend beyond its means) every time the ceiling is raised. The more significant issue facing the government is developing a plan that reduces the government's overall debt.

From The Blog of HORAN Capital Advisors

At HORAN Capital Advisors we do believe the debt ceiling will be increased and if it occurs after the August 2nd deadline, the delay will not have a negative long term impact on the economy. A key will be whether spending reductions are incorporated into any debt ceiling increase that passes Congress.

From an economic perspective, we noted in our recent newsletter that the steepness of the yield curve and bank lending are suggesting a better economic environment ahead. As the below charts detail, the 13-week rate of change in loans and leases at commercial banks has turned positive, i.e., above zero, for the first time since January 2009.

From The Blog of HORAN Capital Advisors

Additionally, the below chart shows the steepness of the yield curve (fed funds versus 10 year treasury). This spread is near a record high and historically recessions have been 3+ years into the future; hence, a double dip recession does not seem to be just around the corner.

From The Blog of HORAN Capital Advisors
Chart source: Charles Schwab

Lastly, recent earnings announcements have been coming in on the strong side as 75%+ of companies that have reported have exceeded expectations.


Tuesday, July 19, 2011

Second Quarter 2011 Investor Letter

The debt ceiling debate is top of mind for investors and the market and our our recently released 2nd Quarter Investor Letter includes commentary on this issue. We hope you find the content of our letter insightful as we look to the balance of 2011.

HORAN Capital Advisors' complete Investor Letter can be accessed at the following link: 2nd Quarter Investor Letter.


Monday, July 18, 2011

The Real Issue With The Debt Ceiling

Much of the media attention surrounding the debate going on in Washington is about the issue of increasing the debt ceiling. If one reads Standard & Poor's recent report that placed U.S. government debt on "Negative Credit Watch", the primary issue cited in S&P's report was not simply an increase in the debt ceiling. A bigger issue cited in the report was Washington's lack of any credible plan on reducing the actual level of debt. In Standard & Poor’s Negative Credit Watch report S&P concluded,
“Congress and the Administration have not achieved a credible solution to the rising U.S. government debt burden [emphasis added] and are not likely to achieve one in the foreseeable future.”
The below video provides a clear summary of the current debate.


Lastly, Karl Denninger of The Market Ticker, provides a detailed summary of the debt issues facing the U.S. in a post titled, The Truth About Budgets, For Both Left and Right. It is an article that should be read in order to better understand the debt issue debate.


Monday, July 11, 2011

Estimated Earnings Growth Through 2012

By clicking the below graphic, readers can access estimated earnings growth rates for the S&P and its sectors through 2012. Beginning in Q4 2011, financials are expected to show the strongest growth in earnings. Only time will tell.

From The Blog of HORAN Capital Advisors


Monday, July 04, 2011

Slowing Emerging Market Economic Growth

Emerging market economies are at risk of overheating; however, many emerging countries are working to stem growth in an effort to prevent a hard landing of their economic growth. The countries at highest risk of overheating are detailed in the below table.

From The Blog of HORAN Capital Advisors

The factors that make up the overheating index are displayed in the below interactive table.


Source:

American Exceptionalism
The Economist
By: R.A.
July 1, 2011
http://www.economist.com/blogs/freeexchange/2011/07/global-growth


Sunday, July 03, 2011

Dividends, Stock Buybacks And Cash Balances All Higher In First Quarter

Stock buybacks and dividend increases for companies in the S&P 500 Index have certainly been on the mend since the end of the financial crisis in 2009. For the first quarter, and on a year over year basis, dividends are 13.7% higher, buybacks are 62.7% higher and buybacks plus dividends are higher by 39.6%.

From The Blog of HORAN Capital Advisors
Data Source: S&P (PDF)

In addition to the improvement in buyback and dividend payments, company cash balances now exceed a record $1 trillion, a 14.6% increase versus Q1 2010. It would certainly be positive if companies had the confidence to commit some of this cash to larger dividend increases.

From The Blog of HORAN Capital Advisors

Below is a table containing the top 10 S&P 500 companies ranked by per share cash balances.

From The Blog of HORAN Capital Advisors

Lastly, investors are encouraged to examine company 10-Qs and 10-Ks to assess the quality of corporate cash balances. An article by professors at Villinova University and Pennsylvania State University title, What's Up With Cash Balances, notes the recent poor quality of cash balances reported in financial reports. For example, in a recent 10-K for Pep Boys (PBY), the company states:
All credit and debit card transactions that settle in less than seven days are also classified as cash and cash equivalents.
Instead of showing as cash, these transactions should be classified as receivables. The article notes other liberties taken by companies with the classification of cash assets. Certainly, corporate cash balances are higher; however, actual cash may note be as high as it seems.


Saturday, July 02, 2011

Significant Decline In Put/Call Ratio And Market Rallies

In our post in mid June titled, Market Adjusting To Slower Growth Economic Environment, we noted the put/call ratio had climbed to 1.1 and was at a level last reached at the market's low in March 2009. At the time of our post, the S&P 500 Index was trading at 1,271. Since that time the put/call ratio has declined to .56 and the S&P has rallied to 1,339, an advance of 5.3%.

From The Blog of HORAN Capital Advisors

The ability of the market to move higher in the coming week's may hinge on the market's view on a number of economic reports next week: durable goods report on Tuesday, jobless claims on Thursday, private payrolls, unemployment rate and wholesale inventories on Friday.


Sunday, June 26, 2011

Michael Mauboussin Interview: Challenging Investors' Behaviors

Consulo Mack interviews Michael Mauboussin in this week's WealthTrack video. Mauboussin is Chief Investment Strategist at Legg Mason Capital. In this interview, Mauboussin discusses why investors tend to buy high and sell low and why higher trading activity often leads to lower returns. Mauboussin is one of the leading experts on the behavioral tendencies that impact investor returns. Mauboussin believes the economy is in the earlier stages of a recovery and favors large cap equities at this point in the economic cycle. This is a must view interview for investors.