Sunday, February 28, 2010

Dividends Will Be A Company's Renewed Focus?

Money manager Neil Hennessy of the Hennessy Funds believes companies will reward shareholders by initiating or increasing dividend payments. In the below video Hennessy explains why he believes company managements will have a heightened focus on dividends.


Saturday, February 27, 2010

Berkshire Hathaway's 2009 Annual Letter Is Out

The much anticipated 2009 Berkshire Hathaway (BRK.A) annual letter to shareholders, written by Warren Buffett, is now available on the company's website. This letter is always an interesting read by investors. I anticipate noting my thoughts on the letter later this weekend. The PDF version of the annual letter can be accessed on Bershire's Hathaway's website.


Thursday, February 25, 2010

The Impact Of Rising Interest Rates On Stocks And Bonds

One thing that seems almost certain is the next move in interest rates will be a move higher. What will a move higher in interest rates mean for stock and bond investors?

It should be noted longer term market rates have already been trending higher over the past twelve months. The 30-year U.S. Treasury rate has increased from around 3.5% a year ago to 4.6% today. Short term rates, i.e., the 1-month Treasury rate, has actually declined from around .20% a year ago to .08% today. In other words the yield curve has steepened. But back to the original question.

For a bond investor, higher interest rates will have a negative impact on the price of a bond or price of a bond mutual fund. The impact of this "interest rate risk" depends on the maturity or duration of a particular bond. In its simplest form, the duration indicates how much the price of a bond or price of a bond mutual fund will change given a 1% or 100 basis point change in interest rates. For example, if the duration of the bonds in a bond mutual fund is 5 years, then the price (NAV) of the bond fund will decline 5% (increase) for a 100 basis point increase (decrease) in interest rates. The question for investors then is how long does it take to recover the loss in principal.

In a recent research article from Charles Schwab (SCHW) titled, Should You Worry About Bond Funds if Interest Rates Rise?, it is noted that,
"More than 90% of the total return since 1976 generated from a broadly balanced portfolio of US investment-grade Treasury, agency and corporate bonds has come from interest payments as opposed to change in price..."
If an investor understands the recovery time, they will then know if their time horizon matches the term or duration of the bonds or bond fund.

For stocks they tend to perform better in declining interest rate environments as well. Unlike bonds though, on average, stocks have generated positive returns in rising interest rate environments as well as in declining rate environments. Although stock returns have tended to be positive in periods where interest rates have increased, the better returns are found in declining interest rate periods.

In Standard & Poor's article, Rising Rates Revisited, they include returns be S&P 500 sector as well.

For investors then, if one believes interest rates will trend higher over a period of time in which it will be necessary to access the principal invested, paying attention to the duration of an investment as well as the types of stocks within a portfolio will be important.

Source:

Should You Worry About Bond Funds if Interest Rates Rise?
Charles Schwab & Co.
By: Rob Williams
February 24, 2010
http://tinyurl.com/ylbmaeu

Rising Rates Revisited
Standard & Poor's
By: Sam Stovall
February 19, 2010
http://tinyurl.com/23j6med


Sunday, February 21, 2010

Investor Fund Flows Favoring Fixed Income Investments

The below chart notes the change in fund flows for the broad mutual fund asset classes of equity, fixed and money market funds. If the line is above the "zero" x-axis, then the respective asset class saw positive fund flows for the period in question. For the periods earlier than 2010, the data is monthly.

The chart shows fixed income funds have generated positive investment flows since September of last year. During that same time period, equity funds saw outflows except for a brief period in early January of this year. The negative flow in money market cash has been driven mostly by institutional investors. Retail investors have actually added to their money market funds since the beginning of February. Is this a contrarian sign?


Investors interested in reviewing the data for a longer time period, the Investment Company Institute website contains more detail on flow data.


Wednesday, February 17, 2010

2010 Dogs Of The Dow Performance Update

The year to date performance of the 2010 Dogs of the Dow are slightly ahead of the Dow Jones Industrial Average Index. As the below table indicates, the best performing Dow dog is Boeing (BA) with a YTD return of 14.2%. The worst performing dog is Verizon (VZ) returning a negative 12%. In 2009, the Dow Dogs slightly underperformed the Dow Index, 17.8 versus 18.8, respectively.


The "Dogs of the Dow" investment strategy is one where an investor ranks the thirty Dow Jones Industrial Average members by yield, highest to lowest, based on the last trading day of the prior year. An investor then invests an equal amount in the ten highest yielding Dow stocks and holds them for one year. More information on the Dogs of the Dow investment strategy and other variations on the strategy can be found at a website devoted to Dogs of the Dow investing.


Sunday, February 14, 2010

4 Dividend Increases Earlier This Month

February is the busiest month for dividend increases and below is detail on four companies increasing their payouts earlier this month.


Sigma-Aldrich (SIAL)
  • announced a 10.3% increase in the quarterly dividend to 16 cents per share versus 14.5 cents per share in the same quarter last year.
  • based on 2010 estimated earnings per share of $3.14, the projected payout ratio is 20%. This compares to the 5-year average payout ratio of 20%.
  • SIAL carries an S&P Earnings & Dividend Quality Ranking of A+ and is one of S&P's Dividend Aristocrats.

United Technologies (UTX)
  • announced a 10.4% increase in the quarterly dividend to 42.5 cents per share versus 38.5 cents per share in the same quarter last year.
  • based on 2010 estimated earnings per share of $4.60, the projected payout ratio is 37%. This compares to the 5-year average payout ratio of 27%.
  • UTX carries an S&P Earnings & Dividend Quality Ranking of A+.

Archer-Daniels Midland (ADM)
  • announced a 7.1% increase in the quarterly dividend to 15 cents per share versus 14 cents per share in the same quarter last year.
  • based on June 2010 estimated earnings per share of $2.96, the projected payout ratio is 20%. This compares to the 5-year average payout ratio of 18%.
  • ADM carries an S&P Earnings & Dividend Quality Ranking of A and is one of S&P's Dividend Aristocrats.

Bemis (BMS)
  • announced a 2.2% increase in the quarterly dividend to 23 cents per share versus 22.5 cents per share in the same quarter last year.
  • based on 2010 estimated earnings per share of $1.92, the projected payout ratio is 48%. This compares to the 5-year average payout ratio of 49%.
  • BMS carries an S&P Earnings & Dividend Quality Ranking of B+ and is one of S&P's Dividend Aristocrats.


Disclosure: Long interest in UTX.


Saturday, February 13, 2010

The Value Is In Quality

For the period between the March low in 2009 and year end 2009, low quality stocks drove the market's move higher last year. The better return that was achieved in the lower quality equity assets in 2009 versus 2208 also occurred in other asset classes as detailed below.
Riskier Assets Outperform

With respect to stocks at this point in time, “If you go farther down on the quality scale, you are not getting a valuation discount,” said Cathy Seifert, head of financial services equity analysis at S&P. As noted in a number of my earlier blog posts, S&P's Quality Ranking measure looks at the growth and stability of a company's earnings and dividends over the prior 10-year period. S&P's research has noted that companies with above average quality rankings tend to outperform over the long run.

"S&P believes that high-quality stocks offer both increased safety of principal and potentially higher long-term returns versus low-quality issues,” says Richard Tortoriello, an S&P equity analyst. “We believe the recent market pull-back offers investors an opportunity to participate in a cyclical bull market. We would favor high-quality issues at this point."

A partial list of the stocks that carry S&P's 4 or 5 STAR rating and also have a buy rating by an S&P analyst is detailed below.


Disclosure:
Readers should assume I have a long interest in each company on the above list and/or may be selling an investment in one or more of the above companies at anytime.


Thursday, February 11, 2010

Conflicting Investor Sentiment Data

The sentiment data reported this week by the American Association of Individual Investors and Investors Intelligence is somewhat conflicting. The individual investor bullish sentiment as reported by AAII shows bullish sentiment rose to 36.75% versus last week's reading of 29.23%. Most of the increase in bullish sentiment came from those investors that were neutral last week. The neutral reading fell over six percentage points. On the other hand, the Investor Intelligence results show:
"bullish sentiment among newsletter writers is currently at 34.1%, which is the lowest level since March 2009. At the same time, bearish sentiment (26.1%) is the highest since November, while the percentage of newsletter writers in the correction camp has sky-rocketed all the way to 39.8%, which is a level that hasn't been seen since 1983," as reported by Bespoke Investment Group.


Tuesday, February 09, 2010

S&P 500 Index Finding Support

Just returned from several days of travel out of town visiting clients in Charleston, S.C. The city of Charleston is rich with history. I must say though, traveling by air is becoming less fun. Getting to a destination seems to take an entire day if you need to change planes along the way, which I had to do. Throw in some weather related delays and that just adds a little more to the travel adventure.

The market continues to look for direction in the face of the negative news related to sovereign debt issues in Greece. Today's market advance came on the back of a potential resolution of the debt crisis with the EU maybe stepping in to provide some support. The downside to this is the lack of moral hazard. As noted in a recent issue of The Economist magazine,
"A messy Greek default would harm almost everybody. As markets and governments know only too well, behind Greece stand others: Portugal, Ireland, Spain and even Italy, the world’s third-biggest sovereign debtor."
Back to the market. The S&P 500 Index (SPX) is attempting to find support around the 150 day moving average. The 200 day moving average is around 1,020. Since late January, the downside volume has been steadily decreasing with volume on up days staying level or trending slightly higher.


The market does appear oversold in the short run. The percentage of S&P 500 stocks trading above their 50-day moving average has declined to 22%. At the beginning of the year, this percentage reached nearly 95%.


Earnings reports for the 4th quarter have been coming in relatively strong. Rightfully so, the market has been focused on top line revenue results. Revenues have been coming in ahead of expectations, but still below year ago levels.


Sunday, February 07, 2010

Catching Up On A Few Dividend Increases From Last Week

Last week saw a number of companies announce increases in their dividends. Two notable increases were from L-3 Communications (LLL) and Colgate Palmolive (CL).

L-3 Communications and Colgate Palmolive dividend analysis table
L-3 Communications
  • announced a 14% increase in the quarterly dividend to 40 cents per share versus 35 cents per share in the same quarter last year.
  • based on 2010 estimated earnings per share of $8.15, the projected payout ratio is 20%. This compares to the 5-year average payout ratio of 16%.
  • LLL carries an S&P Earnings & Dividend Quality Ranking of A-.

Colgate-Palmolive
  • announced a 20% increase in the quarterly dividend to 53 cents per share versus 44 cents per share in the same quarter last year.
  • based on 2010 estimated earnings per share of $4.85, the projected payout ratio is 45%. This compares to the 5-year average payout ratio of 45%.
  • CL carries an S&P Earnings & Dividend Quality Ranking of A+.


Thursday, February 04, 2010

Decline In Bullish Investor Sentiment Continues

Today's release of the American Association of Individual Investor's sentiment survey shows individual investors continue to become less bullish on the market. The current bullishness level takes the bullish sentiment level near one standard deviation below the bullishness average. The bull/bear spread is reported at -14% versus last week's spread of -2%. As this is a contrarian indicator, this is one indicator that suggests the market could be in store for a bounce?


Tuesday, February 02, 2010

Dividend Payers Outperform Non Payers In January

For the month of January 2010, dividend payers in the S&P 500 Index ($SPX) outperformed non payers. January saw the Index decline 3.70% compared to the payers' decline of 2.48% and the non payers' decline of 4.75%. This past January was the first in the last three years where there were no dividend decreases or dividend suspensions for companies in the S&P 500 Index (updated 2/3/2010: Valero (VLO) reduced its dividend 66% in January). In declining markets, dividend paying stocks, and especially dividend growers, tend to hold up better than the overall market.


Friday, January 29, 2010

Urban Outfitters Being Added To S&P 500 Index

Today S&P announced that Urban outfitters (URBN) will be added to the S&P 500 Index on a specific date to be announced in the future. URBN is replacing Affiliated Computer Services (ACS) as ACS is being acquired by Xerox (XRX) and is pending approvals.

(click to enlarge)

Urban Outfitters table replacing Affiliated Computer Services in S&P 500 Index


Thursday, January 28, 2010

S&P 500 Index Short Term Oversold

The percentage of stocks in the S&P 500 Index trading above their 50 day moving average has declined to 34%. This percentage is approaching levels last reached mid year of last year. The percentage of S&P 500 stocks trading above their 150 day moving average remains at a high level of 75%.


Investors Increasingly More Bearish

Since the end of last year, the trend in individual investors sentiment has turned more bearish. This more bearish sentiment shows in the bull/bear spread declining from +26% at the end of 2009 to -2% this week. Bullish investor sentiment this week came in at 35% and is the lowest level since August last year when the bullishness reading was reported at 51%.

Barry Ritholtz of The Big Picture website comments on sentiment this week as well. He notes in his post referring to asset allocation, American Association of Individual Investors (AAII) Equity Allocations, Deviation versus 21-Year Mean:
"while not as ample [liquidity] as near the lows buying power still remains adequate to power/move stocks higher and keep corrections fairly well contained."

Source: American Association of Individual Investors


Tuesday, January 26, 2010

S&P 500 Finding Support At 1,091 Level?

The S&P 500 Index ($INX) seems to be testing support at the 1,091 level over the past several trading days. This same level was reach in early November and early December. At the same time downside trading volume does seem to be losing momentum. Given the strong market advance since March of last year and elevated investor bullish sentiment, investors might want to focus on lower valuation stocks with lower PEGs (P/E to growth rate) and lower debt levels.


Sunday, January 24, 2010

A Decline In Bullish Investor Sentiment

Last week bullish investor sentiment declined to 40% from the prior week's sentiment level of 47.44%. The decline in bullish investor sentiment nearly matched the increase in bearish sentiment. The bearish sentiment reading came in at 34.74% versus last week's 26.92%. The result of these sentiment changes is the bull/bear spread fell to 5% from last week's spread of 21%. Since the release of the sentiment data by the American Association of Individual Investors, the S&P 500 Index has declined 4.1% to 1,91.76.


With this decline in bullish sentiment and decline in the S&P 500 Index, can the market find support at the 1,086 level?


Saturday, January 23, 2010

High Yield Spreads Near Long Term Average

During the depths of the financial crisis last year, high yield spreads widened to near record levels. Spreads in early 2009 approached nearly 2000 basis points. Since that time spreads have narrowed to near their long term average just below 600 basis points.

One question many high yield investors are asking is whether the strong returns in this fixed income segment are behind us. Certainly, the 58% return achieved in the Merrill Lynch High Yield Master II Index in 2009 is not likely to be repeated in 2010. However, as the below chart shows, the spread tends to continue tightening beyond the long term average as the economy improves. Given the low interest rate environment for cash and investment grade debt, investors may continue to chase high yield resulting in further spread tightening.
High Yield Spread 12 2009


Decade Returns Are Strong Following Decades Where Returns Are Weak

The decade of 2000s is now being referred to as the "lost decade". This past decade was only the second one to record a negative return since the negative returning decade of the 1930s. Strong equity market returns tend to follow decades that recorded weak returns. For example, after the worst 10-year periods in the 1930s and 1970s, the market rose 9% and 15%, respectively, on an annual basis over the next decade.

An important factor for investors to consider is to establish an appropriate risk tolerance and time horizon for their investments as the stronger returns can occur later in the decade. The second slide in the below report displays the 10-year rolling returns for the S&P 500 Index since the 1930s.
Lost Decade


Thursday, January 21, 2010

Comprehensive Review Of The Dividend Aristocrats

There tends to be much debate on whether dividends are a critical factor in determining the suitability of a particular investment. One fact is clear though and that is since 1926 the dividend component of the S&P 500 has accounted for one-third of the index's total return. As you read further in this post, Dividend Aristocrats have outperformed the S&P 500 Index on both a return basis and with less risk (beta).


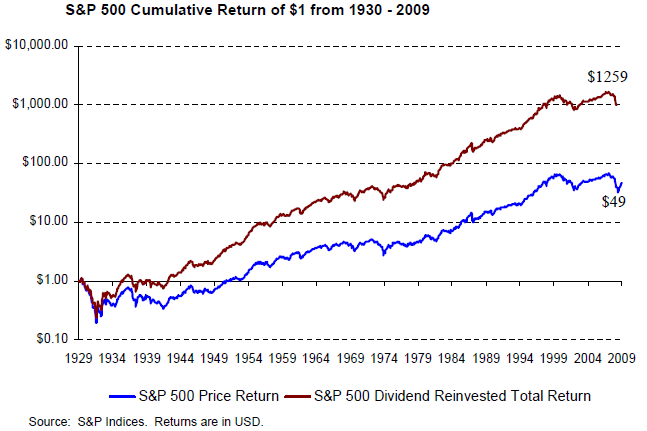
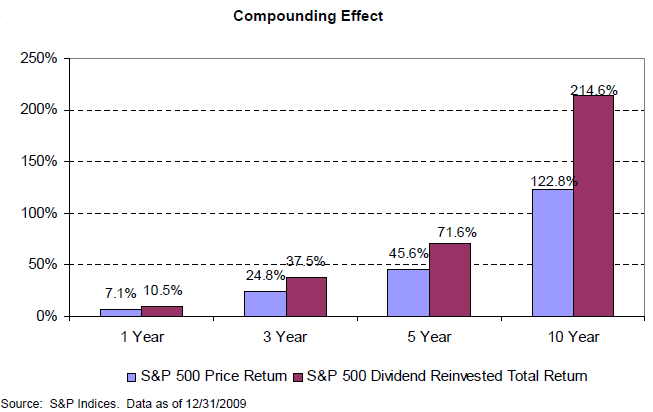
The two charts below show the cumulative return of a dollar for the S&P 500 Index on a price only basis and total return that includes reinvested dividends since 1926. The second chart shows the power of compounding on a percentage basis.


An important factor to review in selecting dividend growth stocks is S&P's Quality Ranking. Standard & Poor's states:
The ability of management to maintain stable or increasing dividends indicate the quality of the firm’s earnings and its growth prospects. The S&P Common Stock Ranking systems, for over 40 years, ranks stocks in categories based on growth and stability of earnings and dividends. [The below chart shows] ...the distribution of quality ranks of the constituents of the S&P 500 Dividend Aristocrats against those of the S&P 500 Index.
Given the strong market returns in 2009, one potential advantage to investing in dividend growth equities and specifically the Dividend Aristocrats, is the Aristocrats tend to outperform the market in down markets. Many are calling for a market correction and the past several days are providing support for that line of thinking. As the below table shows the Aristocrats not only outperform the S&P 500 Index over 3, 5, 10 and 15 year time periods, the Aristocrats outperform while exhibiting less risk. That is the standard deviation of returns is lower for the Aristocrats as compared to the S&P 500 Index.


The calendar year returns going back to 1998 are outlined in the chart below. In down markets the Aristocrats achieve significant outperformance relative to the market.


The math behind compounding shows if one losses less in a down market, it takes a lower return to get back to even. In essence, if one losses less in the down market period, the portfolio will have more invested when the market turns around and moves higher.


Finally, one thing investors need to keep in mind as it relates to the Aristocrats is the 43 stocks that comprise the Aristocrats in 2010 result in some sector overweights and underweights. As an example, the technology weighting is a little over 2% for the Aristocrats and the S&P 500 Index weighting is over 19%. For the staples sector, the Aristocrats list is 23% while the S&P 500 Index is 11%. Therefore, investors need to perform their own research before investing in any stock or buying into any particular strategy like a dividend focused one.


Source:

S&P 500 Dividend Aristocrats
Standard & Poor's
By: Aye M. Soe and Dave Guarino
PDF via .docstoc