Standard & Poor's recently published a paper noting that dividends are not only a critical component of total return, but dividends serve as a cushion in down markets. The paper notes:
- Historically, dividends have contributed nearly one-third of the equity return of the S&P BMI World Index, while capital appreciation has contributed approximately two-thirds.
- When bond yields are low, income oriented investors can switch to dividend paying stocks to enhance current income.
- Dividends allow investors to capture the upside potential while providing downside protection in the down markets.
In looking at the period "August 1989 to September 2008, dividends contributed approximately 28% of the total equity return of the S&P BMI World Index, while price appreciation contributed roughly 72%. From August 1999 to September 2008, dividend income accounted for as much as 52.05% of total return."
The below chart details the contribution of dividends to the monthly total returns of the S&P BMI World Index over the last 19 years.
(click chart for larger image)

And the fact dividends serve as a cushion is noted below:
(click chart for larger image)

Lastly, the compounding of dividends adds significantly to the total return of ones investment. For the 18-year period from January 1990 to December 2008 the price only return for the S&P BMI World Index totaled 101.77% versus the total return (dividends included) on the World Index over that same time period of 146.58%.
(click charts for larger image)
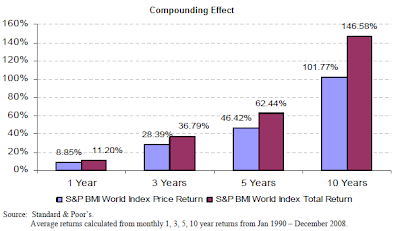

In the end, pursuing an investment strategy that incorporates dividend paying stocks can serve to enhance ones return in down markets. Additionally, the S&P report notes the importance of dividends to the overall return of an index or more specifically stocks.
Source:
Dividend Investing (PDF)Standard & Poor's
By: Aye M. Soe and Srikant Dash, CFA, FRM
October 2008
http://www2.standardandpoors.com/spf/pdf/index/Dividend_Investing.pdf


