Friday, December 08, 2006

Bullish Sentiment Declines Further

In the American Association of Individual Investors sentiment survey release this week, bullish sentiment declined for the fifth straight week. Bearish sentiment fell as well with the neutral category picking up more of the votes. As noted in past posts, this is a contrarian indicator. If bullish sentiment falls to a level like July 20th, this would be one indication the equity market may rally.

(click on chart for larger image)


Source: American Association of Individual Investors


Thursday, December 07, 2006

Dividend Aristocrats Performance for 12.7.2006

On an equal weighted basis, the dividend aristocrats outperform the Dow, S&P 500 and Nasdaq indices on 12/7/06--a down day for the domestic equity markets.

(click on chart for larger image)


Ecolab Inc. Raises Dividend 15%

Ecolab Inc., (ECL) a marketer of cleaning, pest elimination, maintenance and repair products announced a 15% increase in its dividend today. The new quarterly dividend will total 11.5 cents per share versus 10 cents per share in the same quarter last year. The new yield is about 1.0% based on today's closing price of $45.23. The 5-year historical payout ratio is about 29%. Ecolab has an S&P Earnings and Dividend Ranking of A.

(click on chart for larger image)


Wednesday, December 06, 2006

Stryker Doubles Dividend

Stryker (SYK) announced a 50% increase in its dividend. The new dividend will total 22 cents per share versus 11 cents per share last year. The 5-year historical payout ratio is about 6%. Stryker is on of those companies that pays a dividend once a year. The new yield will equal approximately .4%. Stryker has an S&P Earnings and Dividend Ranking of B+.

When looking at dividend growth stocks, factor to consider is the yield level. If the yield is at a low enough level, how meaningful is a 50% dividend increase. The additional cash paid out will not be that significant relative to the level of earnings. On the other hand, the fastest growing dividend payers tend to be those with the lower yields.

(click on graph for larger image)


New Dividend Aristocrats

Questar (STR): STR is a natural gas energy company.

  • Last dividend increase was at a YOY rate of 4% (23.5 cents vs. 22.5 cents per quarter).
  • The 5-year historical dividend growth rate is approximately 6%.
  • EPS estimate for 2006 totals $4.77. Fourth quarter '06 estimate of $1.27 is lower than the fourth quarter '05 earnings of $1.31.
  • Payout ratio approximately 19% versus 5-year average of 30%.
  • S&P Earnings and Dividend Ranking is A.
  • Company added to the S&P 500 Index 11/30/2006.
(click on graphs for larger images)


Compass Bancshares (CBSS): CBSS is a $33.9 billion bank with headquarters in Alabama.
  • Last dividend increase was at a YOY rate of 11% (39 cents vs. 35 cents per quarter).
  • The 5-year historical dividend growth rate is 11%.
  • EPS estimate for 2006 totals $3.53 versus 2005 EPS of $3.23.
  • Payout ratio approximately 45% versus 5-year average of 43%.
  • S&P Earnings and Dividend Ranking is A+.

Cincinnati Financial (CINF): CINF is a property and casualty insurance company.
  • Last dividend increase was at a YOY rate of 10% (33.5 cents vs. 30.5 cents per quarter).
  • The 5-year historical dividend growth rate is approximately 13%.
  • EPS estimate for 2006 totals $3.84 versus 2005 EPS of $3.17 EPS estimate for 2007 is $3.09.
  • Payout ratio approximately 44% versus 5-year average of 41%.
  • S&P Earnings and Dividend Ranking is A-.

Synovus Financial (SNV): SNV is a $31.3 billion bank with headquarters in Columbus, GA.
  • Last dividend increase was at a YOY rate of 7% (19.5 cents vs. 18.3 cents per quarter).
  • The 5-year historical dividend growth rate is approximately 7%.
  • EPS estimate for 2006 totals $1.86 versus 2005 EPS of $1.64.
  • Payout ratio approximately 43% versus 5-year average of 47%.
  • S&P Earnings and Dividend Ranking is A+.

SLM Corporation (SLM): SLM Corporation, also known as Sallie Mae, is engaged in education finance.
  • Last dividend increase was at a YOY rate of 14% (25 cents vs. 122 cents per quarter).
  • The 5-year historical dividend growth rate is approximately 30%.
  • EPS estimate for 2006 totals $2.86 versus 2005 EPS of $2.51.
  • Payout ratio approximately 36% versus 5-year average of 30%.
  • S&P Earnings and Dividend Ranking is B+.


Source: Standard and Poor's


Tuesday, December 05, 2006

Changes to S&P's Dividend Aristocrats Index

In Standard & Poor's annual rebalancing of their Dividend Aristocrats Index, the company announced the changes detailed below. The companies removed from the index are ConAgra Foods (CAG), Merck (MRK) and Alltel (AT).

(click on graph for larger image)


Changes in S&P's Dividend Growth Indices

Standard & Poor's announces changes to their dividend growth indices as follows:

(click on chart for larger image)


Monday, December 04, 2006

S&P 500 Dividend Actions for the Month of November

Following is detail on S&P 500 company dividend actions. All the dividend actions in November were increases. November saw 23 companies increase their dividend versus 25 companies in November of 2005 and 19 companies in November 2004.

(click on chart for larger image)


  • 382 companies (or 76.4% of the companies in the S&P 500 Index) pay a dividend. These companies comprise 85.44% of the market value of the index.


Emerson Electric: Jim Cramer Highlights the Company and its Dividend on Mad Money

Although today was a "great day" for the market, last week was "brutal," Cramer told his viewers. He said he would love to say the selloff is over, but that's not the reality.

Instead, Cramer said he wants market players in secure dividend-boosting stocks, and in particular, he said he wants people to take a look at Emerson Electric (EMR), a stock that has boosted its dividend but has largely been forgotten about because of the selloff.

Although it might not be the most interesting stock, Cramer believes that it could make people money. The company, which should have 15% growth next year, is only trading at 15 times next year's earnings, which makes it "a steal," he said.

Emerson has already reported numbers that are "great," and although the stock should not be allowed to go lower than where it was after a dividend boost, that's what's happening here, he said.

There is "pure opportunity" to buy this stock, which has a 2.5% dividend yield, Cramer continued, adding that its dividend boost shows that Emerson has confidence in its future.

Another reason to buy Emerson now is that because short-term bond rates are higher, an "influx of investors who would have otherwise bought bonds," is likely to come to the market and buy dividend-boosting stocks like Emerson, he said.

The bottom line: "When you have a potential for a selloff, you need a stock that is going to be secure," like Emerson," Cramer said.

Source: Cramer's 'Mad Money' Recap: While Nike Sleeps
December 4, 2006
Emerson Electric is one of Standard & Poor's Dividend Aristocrats and has an S&P Earnings and Dividend Ranking of A.


Sunday, December 03, 2006

Factors that Lead to Poor Investment Decisions

An article on psychological factors that can interfere with an individual's investment decision making is contained on the free content portion of the American Association of Individual Investors website.

The factors noted below are discussed in more detail in the article.

    Decision-Making Biases

  1. Availability: Drawing conclusions based only on vivid and recent information.

  2. Irretrievability: Failing to think beyond a preconceived notion.

  3. Presuming associations: Assuming certain associations exist with no real evidence.

  4. Confirmation trap: An unconscious search for supporting evidence that the right decision has been made, while ignoring evidence that a bad decision was made.

    Measurement Biases

  5. Sample size insensitivity: Reaching a conclusion based on a small sampling of information that does not truly represent the complete situation.

  6. Ignoring regression to the mean: Not recognizing that above- or below-average results won’t necessarily continue forever.

  7. Conjunctive and disjunctive events bias: Mis-estimating the likelihood that certain events will occur when those events must take place for a particular outcome to occur.

    Misperceptions

  8. Insufficient anchor adjustment: Assuming an outcome of an event will be exactly the same as the outcome of a similar prior event without examining differences.

  9. Hindsight: Evaluating a judgment after an event has played out and with perfect knowledge of the outcome.

  10. Positive illusions: A tendency toward overly optimistic views of things rather than a realistic assessment.

    Risk-Taking Biases

  11. Avoiding uncertainty: A preference for stability rather than uncertainty.

  12. Asymmetry of risk tolerance: Investors are risk-averse with regard to gains (preferring to sell “winners” and ensure the gain) but risk-takers when it comes to losses (preferring to hang on to “losers”).

  13. Regret avoidance: Investors tend to feel more regret toward committed actions that have turned out badly rather than omissions that could have turned out favorably.

  14. Internal escalation of commitment: The tendency of an investor to increase the support of their initial decision over time.

  15. Competitive escalation: The tendency of some investors to view competitors’ actions or other investors’ collective actions as validating an investment idea.

Source:
15 Short-Cuts and Biases that Lead to Bad Investment Decisions
Paul S. Szczygiel
AAII Commentary
American Association of Individual Investors http://www.aaii.com/commentary/articles/200605_stockstrategies.cfm


Saturday, December 02, 2006

Non Dividend Payers Outperform Dividend Payers in November

Standard & Poor's reports that in November non-dividend paying stocks in the S&P 500 Index outperformed dividend paying stocks: 3.50% versus 2.28%.

(click on chart for larger image)

Total Return Performance November 30, 2006
Source: Standard & Poor's


Dividend Aristocrats Performance December 1, 2006

Just an FYI. I have been traveling since Thursday night and have limited access to the internet so posts will be sporadic until Monday.

Aristocrats certainly performed better than the tech laden Nasdaq on Friday.

(click on chart for larger image)


Thursday, November 30, 2006

Eaton Vance's 8th Annual Investor Survey Recap

Today, Eaton Vance reported findings from its eighth annual investors' survey. The study revealed interesting results about investor views on dividends. Also, an interesting data point was GenXers views on real estate as an investment (sounds the same as Boomers perception of technology in late 1999).

Following are highlights of the survey results:
  • The great majority of American investors (73%) agree with the statement: "Firms that pay dividends tend to be predictable cash generators, and healthy dividends are a sign of financial strength."

  • Three times as many investors (45%) say they increased investment in dividend-payers over the past three years as say they decreased investment in these stocks (16%).

  • Investors show a strong preference for companies using dividends to return cash to shareholders, with two-thirds (69%) indicating they prefer a company to pay a dividend rather than only buying back stock.

  • More investors (44%) say they prefer a smaller dividend grown annually over a large but unchanged dividend (25%) or share buybacks (19%).

  • Senior investors are more likely to indicate a preference for dividends over buybacks (74%) than Baby Boomers (62%).

  • GenXers also indicated a strong (70%) preference for dividends.

  • The popularity of dividends is reflected in the fact that over half of investors (58%) say they currently invest in dividend-paying stocks.

  • Few investors (3%) knew that nearly two-thirds, or 64%, of the overall return from stocks as measured by the S&P 500 Index has historically come from reinvested dividends (Source: Ned Davis Research).

  • Half of investors (51%) who increased investments in dividend-paying stocks over the past three years say the reduction of the tax rate on dividend income to 15% in 2003 was a factor in their decision to do so.

  • Notably, 52% of GenXers--the most of any generation--say they would start investing or increase their investments in dividend-paying stocks if Congress makes the tax cut permanent.

Regarding asset preferences:

  • Senior investors (34%) and Baby Boomers (31%) choose stocks as the investment they think of first for income generation, while GenXers (34%) say real estate.

  • In fact, as the results of Eaton Vance's study show, investors' perception of real estate as a reliable return generator persists, despite the fact that the housing market has slowed dramatically, with September housing starts down 18% year-over-year (Source: U.S. Census Bureau News). Nearly as many investors predicted real estate would offer the best after-tax returns among major investment categories over the next five years as picked stocks (30% versus 35%).

Details about the survey:

"This summary highlights the major findings of a comprehensive telephone study among 1,209 U.S. residents 25 years and older (about 400 per age cohort: GenXers 40 and younger, Boomers 45 to 60 and seniors 65 years or older), who have over $50,000 invested in both qualified retirement plans and investments outside of qualified retirement plans (stock mutual funds, bond mutual funds, individual stocks, individual bonds, variable annuities and money market funds). This study, which represents a portrait of American investors' attitudes and practices about investing across three generations, was conducted by Penn, Schoen & Berland Associates, Inc. for Eaton Vance Corp.

This representative national study of 1,209 American investors was conducted between October 2 and November 11, 2006. By definition, all investors surveyed have a portfolio of at least $50,000, excluding housing. 71% have investable assets greater than $100,000, while one in seven have a portfolio of $1 million plus"


Source:
MSN Money
September 30, 2006
http://news.moneycentral.msn.com/ticker/article.aspx?Symbol=US:EV&Feed=BW&Date=20061130&ID=6237398


Bearish Sentiment Continues to Move Higher

Bearish sentiment as reported by AAII rises again as reported for November 30, 2006. Bullish sentiment stills seems a little high; however, is this contrarian indicator indicating another leg up for the market?

(click on chart for larger image)


Wednesday, November 29, 2006

The Importance of Understanding the Difference between Earnings, Operating Cash Flow and EBITDA

An attractive aspect to using a dividend growth methodology in evaluating stocks is the dividend growth method enables an investor to gauge, indirectly, the cash flow of a company. Because cash is important to a company's survival, changes in a company's dividend practices may signal future cash flow issues for a company.

Dividend growth stocks should not be looked at as simply investments that grow their dividend on an annual basis; but, the methodology leads to investment in companies that are growing their business as evidenced by growth in company cash flow. The other important aspect to successfully investing in dividend growth companies is to focus on the higher quality firms as rated by Standard and Poor's. S&P's Quality Ranking measure attempts to capture the "quality" of earnings issue.

What is cash flow versus earnings? Earnings of a company are essentially a figure derived from accounting rules. The problem with "earnings" or "net income" from an accounting perspective, is the figure has very little to do with evaluating the cash flow stability of a company.

Cash flow comes in two forms: "operating" cash flow and simply cash flow. The latter is commonly referred to as EBITDA (earnings before interest, taxes, depreciation and amortization). The problem with the EBITDA calculation is the number is based largely on earnings. The website stockdiagnostics provides the following interesting definition of EBITDA:
"(EBITDA) is calculated by adding "selected" expense items such as Interest expenses, Income taxes, Depreciation and Amortization back into earnings or net income. By adding "selected" expense items back into to a company's net income "more positive" earnings or cash flow per share numbers can be manufactured. When utilizing EBITDA an analyst or CFO is actually stating, "This is what our earnings would have been if it were not for interest, taxes, depreciation and amortization." Because it is based upon earnings, EBITDA is subject to the same "creative" accounting inherent in many earnings reports. EBITDA frequently does not reflect a company's true cash flow.... EBITDA is a manufactured "creative accounting" interpretation that presents a company in the best possible light. EBITDA's original use was for lenders to determine credit viability. Today these interpretations are used primarily by companies and Wall Street analysts to promote stock to an unwary public. Commonly, when EBITDA or CFPS (cash flow per share) are used in this way they are deceptively called "cash flow" or some form thereof."
Operating cash flow is a measure that incorporates changes from the balance sheet and income statement that have an impact on cash. The operating cash flow information is contained in SEC filings of companies. In the SEC financial filings for companies, firms include an income statement, balance sheet and statement of cash flow. One of the most important financial documents in the filing is the statement of cash flow. This statement reconciles the cash balance on the balance sheet by incorporating changes in categories from the income statement and balance sheet accounts. For example, all else being equal, if inventory increases, this reduces cash flow since cash was used to purchases the inventory. Of course, the inventory could be purchased on credit; then accounts payable would increase and this increases cash flow. The statement of cash flow contains three sections:
  • Cash provided by operating activities,
  • Cash provided by investing activities, and
  • Cash provided by financing activities.
The key section to review on the cash flow statement is the one detailing operating cash flow.

Once the operating cash flow figure is analyzed, it should be converted to a per share number. This figure can be evaluated across quarters to determine any negative or positive trends. Additionally, growth, or lack of growth in operating cash flow per share can be compared to companies within the same industry or across industries. The last step in this analysis is to take the price of the stock divided by the operating cash flow per share to come up with a price to operating cash flow figure. This number can be used to evaluate stocks in the same way one uses the P/E ratio.

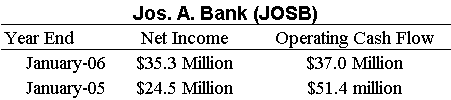
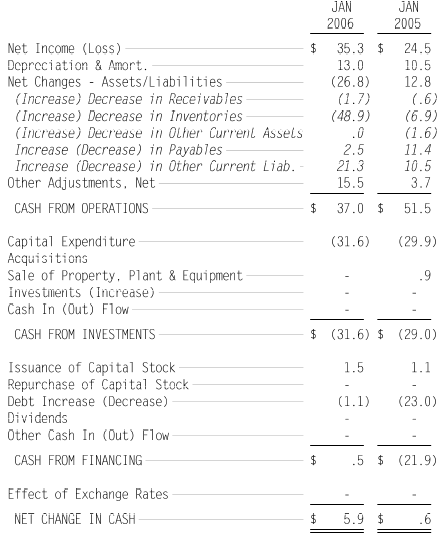
Following is an example detailing the difference in a company's net income and operating cash flow:

(click on tables for larger image)


Jos. A. Bank (JOSB) Cash Flow Statement
($ in millions)


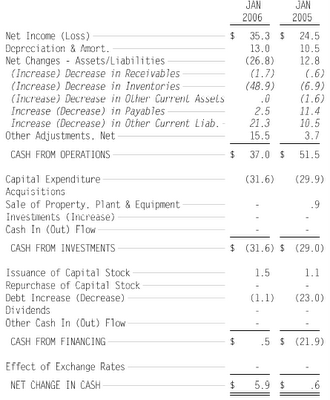
As one can see from the above charts, net income has grown nicely, but cash flow has actually declined from year end '05 to '06. Note the large cash usage ($48.9 million) in 2006 attributable to an increase in inventory.


Tuesday, November 28, 2006

McCormick & Company Increases Dividend 11%

Today, McCormick & Co. (MKC) announced a 11% year over year increase in the company's quarterly cash dividend to 20 cents per share versus 18 cents per share in the same quarter last year. MKC maintains an S&P Quality Ranking of A+. In the press release, the company's CEO stated:

"In 2006 we have rebounded from a challenging 2005 fiscal year. Our financial results through the first three quarters have exceeded our expectations and the stock price has risen 20% in the past 12 months."


Dividend Growth versus Stock Buybacks

In today's Ahead of the Tape section of The Wall Street Journal, the column discusses some pros and cons of stock buybacks. The article cautions investors that a company's stock buyback announcement should not be taken at face value.
"Buybacks aren't always what they seem. A company might throw confetti for its share repurchase plan with one hand while issuing shares with the other."
The article further cautions investor not to mistake earnings per share growth from buybacks with actual EPS growth.
"At the same time, investors need to be careful to avoid mistaking earnings-per-share growth from buybacks for actual earnings growth."
One way an investor can obtain insight into the true earnings picture of a company is to review the company's cash flow statement. Additionally, an investor can monitor the dividend growth rate of a company to better gauge what the company's board might be projecting about future business prospects. If the dividend is not growing at a rate equal to or greater than the historical dividend growth rate for the company, maybe the earnings growth of that particular company is being enhanced by other factors such as stock buybacks.


Source:
Self-Serve in the Boardroom
JUSTIN LAHART
AHEAD OF THE TAPE
The Wall Street Journal Online, November 28, 2006 http://online.wsj.com/article/SB116466998414033857.html?mod=mkts_main_featured_stories_hs


Monday, November 27, 2006

Dividend Aristocrats Performance in a Down Market

One of the advantages to investing in higher quality dividend paying stocks is the fact they historically have held their value better in a down market. Standard and Poor's Dividend Aristocrats' performance held up better in today's down market. These higher quality dividend paying stocks also performed substantially better than the Nasdaq index:

(click on chart for larger image)


Determining the Valuation of Dividend Paying Stocks

An important aspect to investing in stocks is attempting to determine the stocks appropriate valuation. Following is information covering the analysis and valuation of dividend paying stocks.

The most common method used in valuing dividend paying stocks is to use the Dividend Discount Model (DDM), commonly referred to as the Gordon Model. The basic tenant of the model is a company's stock is equal to all of that company's expected future cash flow (dividends in this case) discounted back to the present (time value of money concept) using an appropriate discount factor. More information on the DDM approach can be found here.

The following website contains a Dividend Discount Model calculator to assist one in determining an expected fair value of a particular stock: www.dividenddiscountmodel.com.(the dividend discount model site is not active at this time-April 16, 2008)) The site answers the question of why use the DDM:

"The dividend discount model (DDM) is a widely accepted stock valuation tool found in most introductory finance and investment textbooks. The model calculates the present value of the future dividends that a company is expected to pay to its shareholders. It is particularly useful because it allows investors to determine an absolute or "intrinsic" value of a particular company that is not influenced by current stock market conditions. In contrast, most target prices published by analysts are set on a relative basis, based on the valuation of comparable companies. The DDM is also useful because the measurement of future dividends (as opposed to earnings for example) facilitates an "apples-to-apples" comparison of companies across different industries by focusing on the actual cash investors can expect to receive. Although it is conceptually simple, the DDM is not widely used except by some institutional investors because it can be cumbersome to apply without the necessary data and analytical tools. DividendDiscountModel.com makes the DDM accessible to all investors to determine whether they think a particular stock is over or under valued based on its dividend potential.

The Dividend Discount Model is also known as the "Gordon model" named after professor Myron J. Gordon who popularized the model. Professor Gordon wrote about the model in a book he authored in 1962 titled The Investment, Financing and Valuation of the Corporation. Since then the model has appeared in virtually every investments textbook. In his book titled Investment Valuation, Aswath Damodaran, a professor at New York University states: "In the long term, undervalued (overvalued) stocks from the dividend discount model outperform (underperform) the market index on a risk-adjusted basis." Although no investment model works for all stocks all of the time, the dividend discount model has proven to be a reliable way of selecting stocks that on average will perform relatively well on a long-term basis. It should be among the tools that investors use to select at least some of the stocks in their portfolio."
A more flexible and detailed DDM program can be found by clicking here. The Excel file to review is named divginzu.xls in the section of the table titled "All-in-one Valuation Models". A review of the inputs in the Excel file noted previously will provide a more comprehensive understanding of the DDM concept for the investor wanting to analyze their own stock investments.

This brief post does not do justice to the complexity of valuing stocks using the DDM approach. For instance, all stocks do not pay a dividend and the dividend grow rate is not level for companies. There are variations of the DDM to account for these differences and I will cover these topics in future posts. In the interim, if a reader has specific questions on the DDM or topics to focus on in the future, leave me a comment or email.


Sunday, November 26, 2006

Dividend Growth Stocks In A Slowing Economy

A recent BusinessWeek online article titled, Making Dividend Plays Pay, and an excerpt from a Standard Poor's Equity Research report, contained an analysis of the yields, payout ratios, and quality make up by sector for several S&P indices.

(click on chart for larger image)


The article outlines the importance of reinvested dividends:
"Dividends—those steady streams of periodic payments received by equity investors—may seem as unexciting as a Social Security check, but you might think again when you realize that reinvested dividends have actually contributed more than 40% of the S&P 500's total return since 1929 (emphasis added). What's more, the S&P 500 dividend yield averaged nearly 4% in all years since the mid-1930s and averaged nearly 6% during the 1940s. Things look a little different these days, of course. The yield on the "500" has averaged only 1.6% thus far this decade, after averaging only 2.4% during the 1990s..."

S&P believes the economy is entering a slower growth phase. As a result, they believe investors should focus on higher quality dividend paying stocks:

"Due to the expected tepid market performance, S&P recommends that investors gravitate toward sectors and companies that offer relatively high dividend yields and have consistently increased their earnings and dividends over an extended period of time."


Source:
Making Dividend Plays Pay
SAM STOVALL
SAM STOVALL'S SECTOR WATCH
BusinessWeek Online, September 5, 2006 http://www.businessweek.com/investor/content/sep2006/pi20060905_559905.htm