Large cap value stocks have come to life this year after underperforming growth for most of the last 15-years. As the below chart shows, the Invesco Pure Value Index (RPV) is up nearly 15% this year compared to the Invesco Pure Growth (RPG) Index return down .12%.
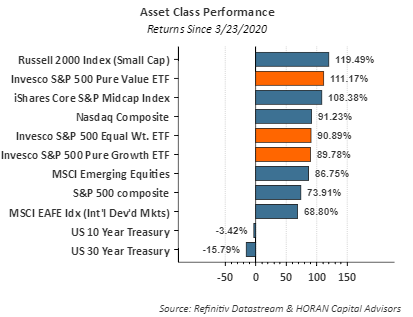
Even on a slightly longer term time frame Pure Value is outperforming Pure Growth. The below bar chart shows the Pure Value return of 111% out paces the 89% Pure Growth return since the March 23, 2020 market low.
The return of value oriented equities trails the growth oriented stocks by a fairly wide margin since early 2006. In the below chart, Pure Value lags Pure Growth by nearly 200 percentage points, a period of time spanning fifteen years. A narrowing of the performance gap would not be unexpected.

The near term outperformance of value noted above might be the beginning of a more sustainable period of outperformance for value type equities. One factor contributing to value's outperformance is the fact the economy is exiting the recession that was triggered by the pandemic shutdown. As I noted in a post several years back,
Why It Matters That Value Stocks Are Outperforming Growth Stocks, the value asset class tends to do better than growth as the economy exits a recession and resumes its growth. A steepening yield curve is another indicator that suggest the economy's growth is quickening. A steeper curve also helps financial stocks which are a large weighting in the the Pure Value Index. The green line in the below chart represents the yield curve, i.e., the 10-Year Treasury minus the 2-Year Treasury, and clearly the curve's steepening appears to have accelerated. Importantly, the value outperformance and a steeper yield curve can be short lived. In 2016 the below chart shows value stocks were outperforming as the yield curve was steepening. The outperformance lasted all of about one year.

Of course things are not always as clear as they might seem. The Fed's involvement in the government and corporate debt market influences the curve's moves and can upend what should be a normal cycle occurrence. Additionally, our view in order for value to outperform for a sustainable period, economic activity needs to continue its improvement. Certainly, 2021 looks like the economy could grow at a fast pace, maybe 6%-7% GDP growth, as pent-up demand is satisfied. However, policy decisions from Washington, DC can create headwinds for economic growth after 2021, and if that plays out, slower economic activity would favor growth type equities as I note in that earlier article link.


No comments:
Post a Comment
Note: Only a member of this blog may post a comment.