Sunday, June 26, 2011

Michael Mauboussin Interview: Challenging Investors' Behaviors

Consulo Mack interviews Michael Mauboussin in this week's WealthTrack video. Mauboussin is Chief Investment Strategist at Legg Mason Capital. In this interview, Mauboussin discusses why investors tend to buy high and sell low and why higher trading activity often leads to lower returns. Mauboussin is one of the leading experts on the behavioral tendencies that impact investor returns. Mauboussin believes the economy is in the earlier stages of a recovery and favors large cap equities at this point in the economic cycle. This is a must view interview for investors.


Saturday, June 25, 2011

Mid Cap Relative Valuations At Historically High Levels

Since January 1, 2000 small cap and mid cap stocks have significantly outperformed large cap U.S. equities.

From The Blog of HORAN Capital Advisors

From a valuation perspective, since the beginning of 1992, mid cap equities are trading at historically high valuations compared to large cap stocks on a relative basis. Absolute valuations of mid cap stocks still look reasonable; however, if there is a reversion to the mean, large cap equities are likely to gain the upper hand on performance as one looks forward. Maintaining some exposure to mid caps will likely be beneficial though as merger activity often times targets the mid cap companies.

From The Blog of HORAN Capital Advisors


Sunday, June 19, 2011

Market Adjusting To Slower Growth Economic Environment

Market volatility of late seems to be the norm due to concerns over European debt defaults, budget deficits and slow worldwide growth expectations. These issues are being somewhat offset by the large amount of liquidity that resides on corporate and individual balance sheets. This liquidity is seeking a home that offers better returns than U.S. Treasuries. The 5-year Treasury is yielding around 1.53% and the 10-year treasury is under 3%, trading at a yield of around 2.95%.

Our positioning of our client portfolios maintains an overweight in health care (more defensive sector) and technology (generating strong earnings growth). We continue to maintain an underweight in the financial sector, more specifically in banks, due to our concern about their earnings growth ability in the near term given the large amount of regulation coming out of Washington D.C. Our portfolio structure continues to focus on reducing the volatility in our client investment accounts.

We do believe the economy is still growing, although at a slow pace. Some of the factors inhibiting growth are the result of supply chain disruptions caused by the tsunami in Japan and floods in the Midwest. We believe the recent market pullback is an adjustment to a slower growth global economic environment.

It is likely money flow into equities and out of bonds could pickup in the second half of this year coincident with better clarity on economic growth. The financial condition of most large companies is strong as they hold record levels of cash on their balance sheet and continue to deliver strong earnings results, although earnings comparisons become more difficult in the second quarter. These financially strong companies should provide better returns than the low rates available on treasuries. The recent market pullback seems to be providing investors underweight in equities with an opportunity to add to equity allocations and/or equity positions.

The equity put/call ratio at 1.1 is higher than the level reached at the market low in July 2010 and higher than the level at the market's low in March of 2009.

From HORAN Capital Advisors

Additionally, individual investor bullish sentiment as reported by the American Association of Individual Investors remains at low levels. Last week's reading was reported at 29.0%. Although this represents an increase of 4.58% from the prior week's reading, the 8-period moving average continues in a downtrend and came in at a lower 30%. This contrary indicator tends to be most accurate at the extremes.

From HORAN Capital Advisors

The excessive investor pessimism, a potential resolution to the Greek debt crisis before the end of the weekend or early next week, even if only a short term one and decent equity fundamentals could see the market recover from oversold conditions in the near term.


Thursday, June 09, 2011

Bullish Investor Sentiment In Continued Downtrend

This morning the American Association of Individual Investors reported a decline in individual investor bullish sentiment 24.42% versus last week's reading of 30.18%. The bearish sentiment level jumped over 14% to 47.67% versus last week's bearishness level of 33.43%. This resulted in a bull/bear spread of -23.3% versus last week's -3.3%. Lastly, the 8-period moving average of the bullish sentiment reading is approaching levels reached in March 2009, a market turning point.

From The Blog of HORAN Capital Advisors


Monday, June 06, 2011

Market Is Looking Oversold

The S&P 500 Index has generated a negative return in each of the last five weeks and has started the sixth week on a down note. From a technical perspective the market appears oversold.

The percentage of stocks selling above their 50 day moving average has fallen to levels last seen during the March lows earlier this year. After the close today only 24% of S&P 500 stocks are trading above their 50 day moving average compared to 27% in March. Additionally, the percentage of stocks trading above their 150 day moving average is at a level last seen in the third quarter of 2010.

From The Blog of HORAN Capital Advisors

From The Blog of HORAN Capital Advisors

From The Blog of HORAN Capital Advisors


Saturday, June 04, 2011

The Dow Struggles In The Month Of June

Chart of the Day recently provided information on the historical monthly performance of the Dow. Below is what they had to say along with their graphic.
"[The] chart illustrates the Dow's average performance for each calendar month since 1950 (blue columns) and the average monthly performance of the Dow from 1950 to the present (gray line). [The] chart illustrates that the Dow has tended to perform best during the last several months and first several months of a calendar year. During the middle of a calendar year, the Dow has tended to struggle (with the exception of July). It is worth noting that there have been only two calendar months during which the Dow has declined on average -- June and September."
From The Blog of HORAN Capital Advisors


Wednesday, June 01, 2011

A Slow Growth Market Environment

Before May and now the first day of June, it seems the S&P 500 Index desires to do anything but move higher. The S&P 500 Index had advanced over 9% through the first four months of the year. It is not reasonable to think the market can move higher by 9% every four months. So in May, the S&P declined 1.13% and June is starting off on a weak note by declining 2.28%. After the markets decline today, the S&P 500 Index is still up 5.38% on a year to date basis.

The next support level for the S&P is 1,305; however, it is difficult to guess market bottoms. From a fundamental perspective though, valuations for large cap U.S. equities continue to look more and more attractive. The forward four quarter P/E ratio for the S&P 500 Index is 12.8 times based on projected earnings of $103.57 for the S&P 500.

From The Blog of HORAN Capital Advisors

From The Blog of HORAN Capital Advisors

The sell off today was triggered by the weaker than expected ADP payroll report. Unfortunately, we believe this type of weaker, or less than robust, economic data will be the norm over the course of the next 6-12 months. The unemployment rate will likely remain stubbornly high as we noted on page 3 of our first quarter investor letter.

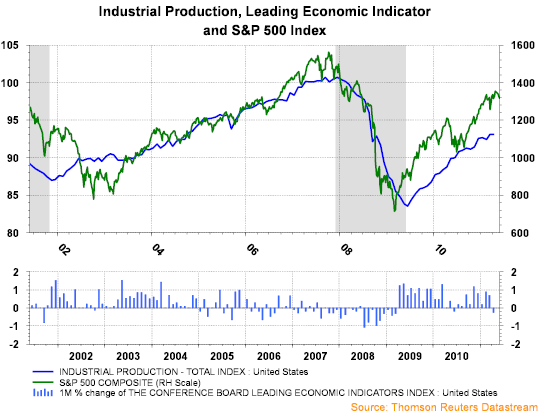
The small down tick in the U.S. Leading Economic Index is not unusual when the economy is entering the mid-cycle of a recovery.

From The Blog of HORAN Capital Advisors

Additionally, companies have reduced inventory levels relative to sales to the point that a slight improvement in demand will likely result in the need to increase manufacturing to replenish stocks.

From The Blog of HORAN Capital Advisors

And finally, as Liz Ann Sonders notes in a recent strategy article, Chief Investment Strategist at Charles Schwab & Co. (SCHW),
"The...massive flow disruptions in Japan are already beginning to turn. Commodity prices have come off the boil. Finally, both monetary and fiscal policy remains stimulative; even considering the finale of QE2 in a few weeks. The Fed has no intention of draining its balance sheet any time soon, nor raising rates.

Corporate America has rarely been healthier, and the cash firepower available to companies is massive. Debt-to-equity for US companies is at its lowest in over 20 years and they hold nearly $2 trillion in cash on their balance sheets.

With leverage so low, if it simply returned to the average of the past decade, companies would have an extra $2.7 trillion to spend, according to the Financial Times. Deal-making is back.

In sum, growth has certainly slowed, but many of the contributing factors are temporary in nature. Assuming US GDP growth can rebound back above 2%, historically this isn't a bad backdrop for stocks. Looking at all years when US GDP growth was between 2% and 3%, the average return for the S&P 500 was nearly 14%, with only two down years out of 11 total. Not bad (emphasis added)."

Disclosure: Long SCHW