
After the strong returns for the market in the first two months of the year, March appeared to served as a digestive phase for the market. Not surprisingly, since the beginning of March, the S&P 500 Index seems stuck in a trading range. From a pure technical perspective, the chart pattern that appears to be unfolding is a bullish inverted head and shoulders pattern. In order to complete this pattern, formation of the right shoulder is necessary with a sell off in the S&P 500 Index down to around 1,300. The market closed today at 1,314 so it is not far from this point. Additionally, a sell off with higher down volume would be positive as well. With tomorrow being an option expiration day, one could envision a higher volume down day occurring and completing the bottom of the right shoulder.
 |
| From The Blog of HORAN Capital Advisors |
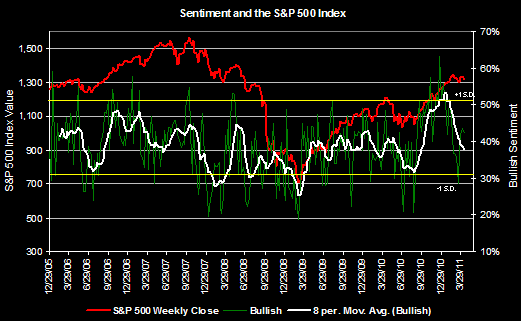
Individual investor sentiment does not seem overly bullish either, which is a positive contrarian indicator. This week's sentiment survey reported by the American Association of Individual Investors reported bullish sentiment of 42.2%. This is down 1.4% from last week's bullishness reading. As the below sentiment chart shows, individual investor bullish sentiment has not reached an extreme level. As an observation, these sentiment indicators tend to be most accurate at extreme levels.
 |
| From The Blog of HORAN Capital Advisors |
In short, the market seems poised to move higher in a "climb the wall of worry phase". In July 2009, I discussed this wall of worry phase in a post, Where Are We In The Market Cycle that readers may find of interest.


No comments :
Post a Comment